A masterplan drawing shows how a whole district, campus or city is meant to fit together: where the streets and open spaces go, which land gets which use, how big the buildings are and in what order it all gets built. At that scale single buildings shrink to blocks, so the drawing style does much of the explaining.
This guide covers 15 masterplan drawing styles, each shown with a real plan, from Pierre L’Enfant’s 1791 manuscript for Washington and Walter Burley Griffin’s Canberra competition entry to a Stuttgart land-use framework and an airport phasing plan. Each comes with notes on producing the look yourself. If you want people, trees and cars for a rendered masterplan, Archtene’s free architectural cutouts include plan-view sets you can drop straight onto a base drawing.
Masterplan drawing at a glance
- What it is: a large-scale plan that sets out the layout, uses, density and phasing of a district, campus, town or city
- Core layers: context and topography, street and movement network, blocks and plots, open space, land use, building massing, phases
- Common styles: concept sketches, diagrams, figure-ground, land-use, massing, phasing and rendered presentation plans
- Rule of thumb: one drawing, one message. Split land use, movement and phasing into separate sheets before you crowd them onto one
What a masterplan drawing has to do
A masterplan is read by councillors, developers, engineers, residents and the architects who design its buildings years later. It has to show the big structure at a glance and still hold enough detail to be measured and argued over, which is why it is rarely a single drawing. A typical set has a concept diagram, land-use, movement, massing and phasing plans, and one illustrative plan or aerial view tying them together. A masterplan also differs from a site plan, which places one building on one lot. Our guide to site plans in architecture covers that scale; think of a masterplan as many site plans organised by a shared set of rules.
15 masterplan drawing styles
1. Loose concept sketch masterplan
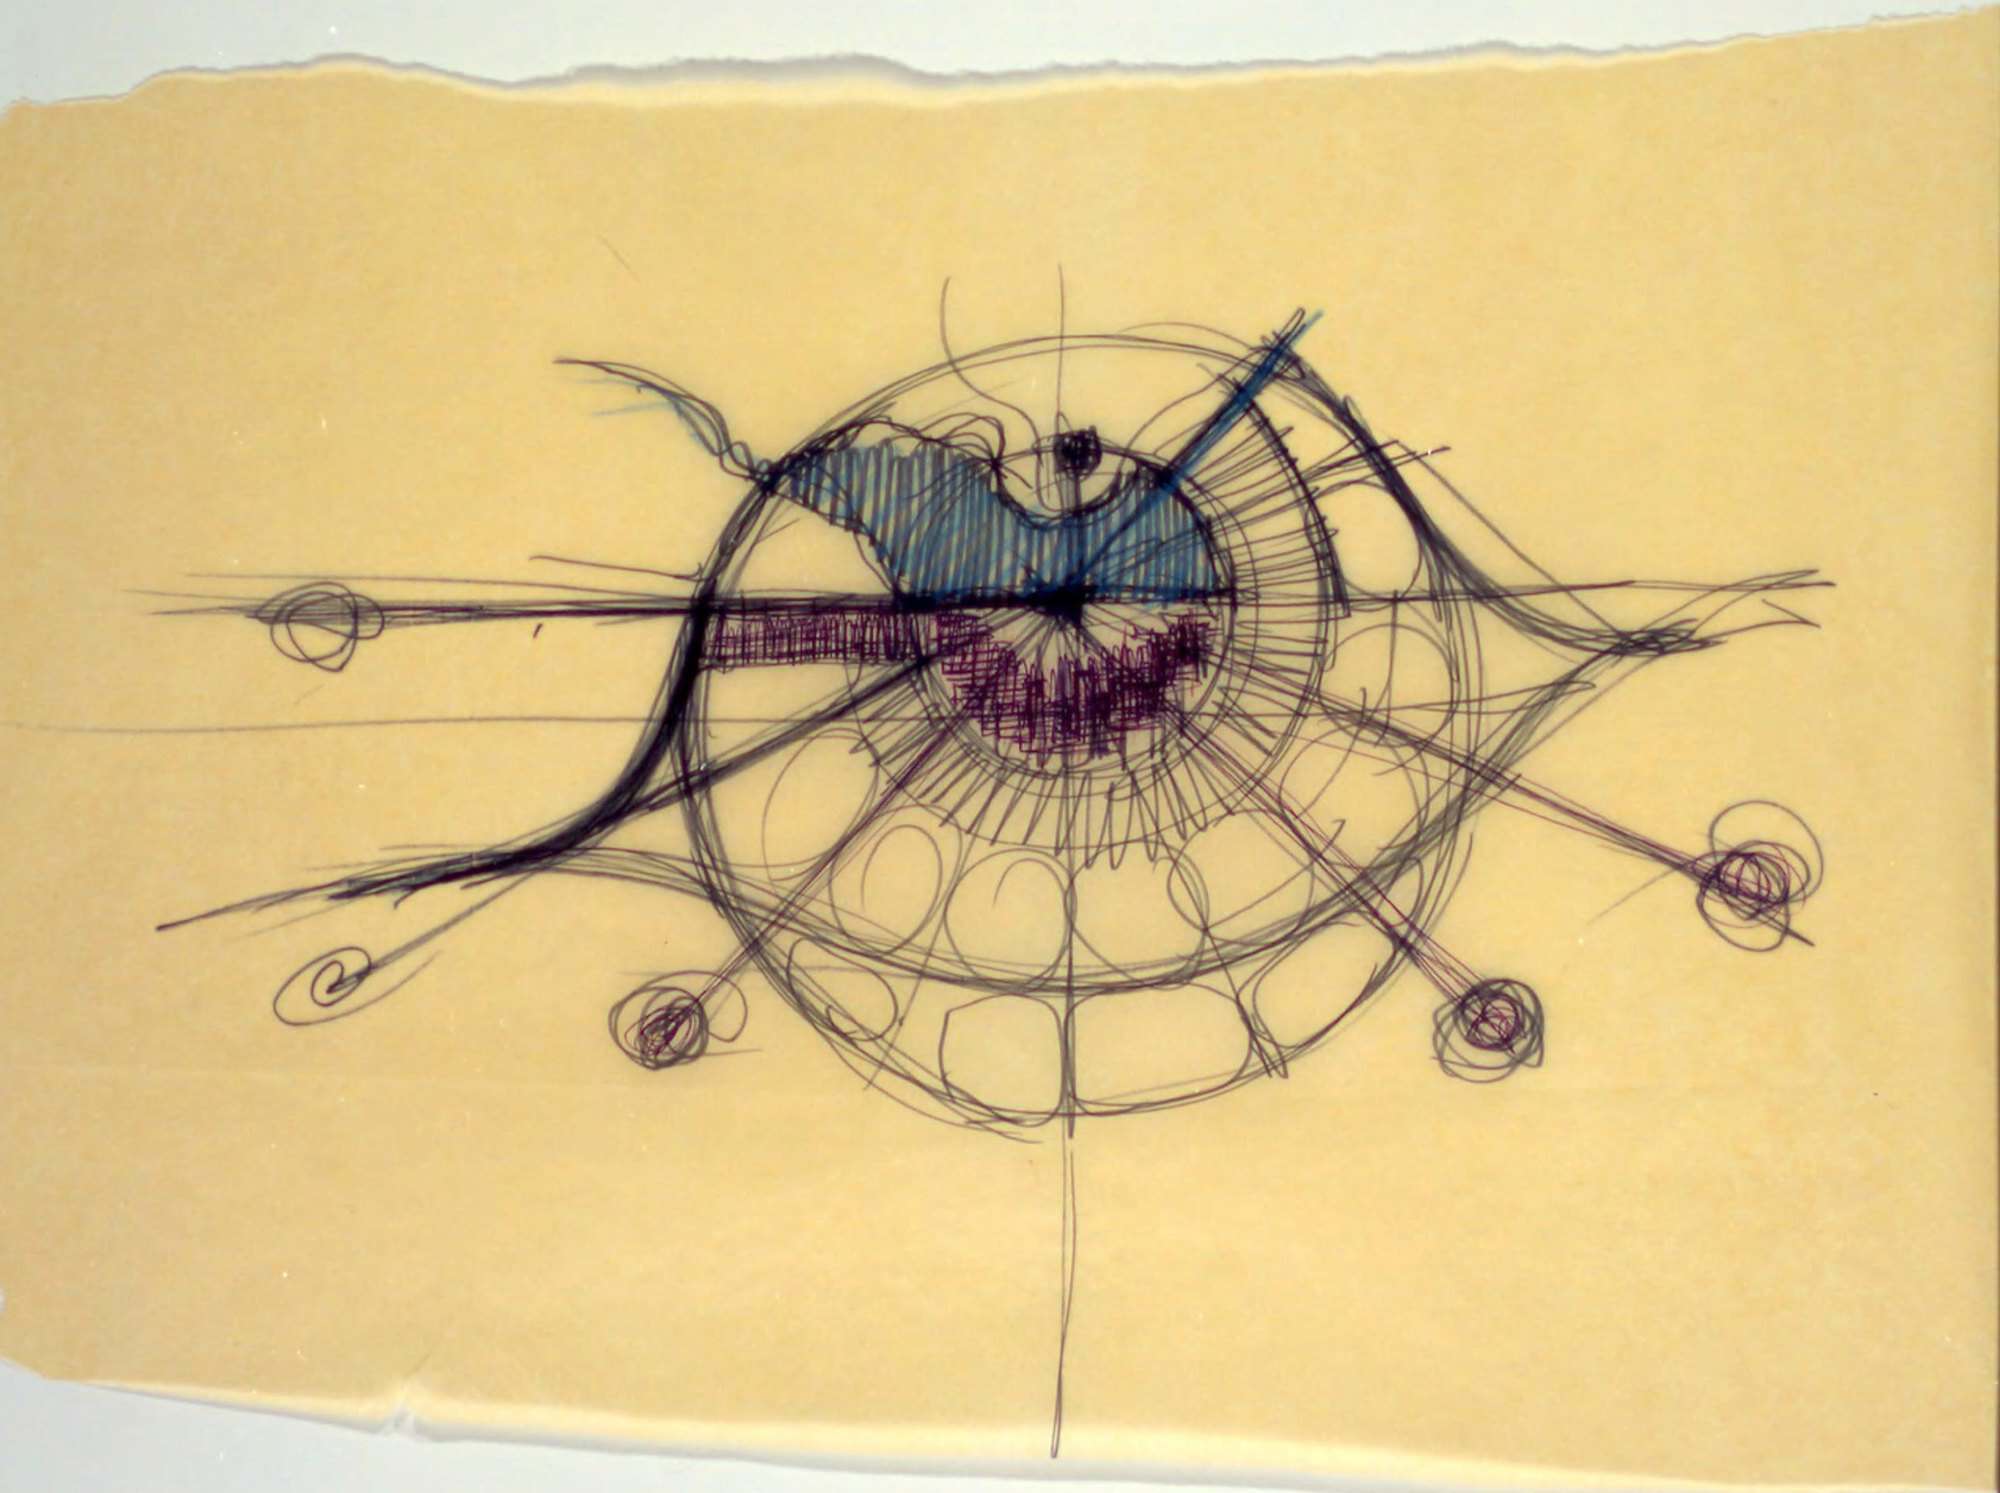
Most masterplans start as a quick sketch testing one big idea. This early 1980s sketch by Gunnar Birkerts for the Domino’s Farms office park in Ann Arbor Township, Michigan, proposes a circular plan: a ring of buildings around a central space, with roads sweeping in tangentially and small satellite circles off to the sides. Domino’s founder Tom Monaghan rejected the circle and asked for a linear form, which was built in stages through the 1980s and 1990s.
How to do it: Work on yellow trace over a printed base at a small scale, with one dark pen for structure and one or two coloured pencils for the key zone. Keep rejected options; they are useful evidence in a design report. Our architectural sketch styles post covers the pens and papers.
2. Diagrammatic ring and sector plan
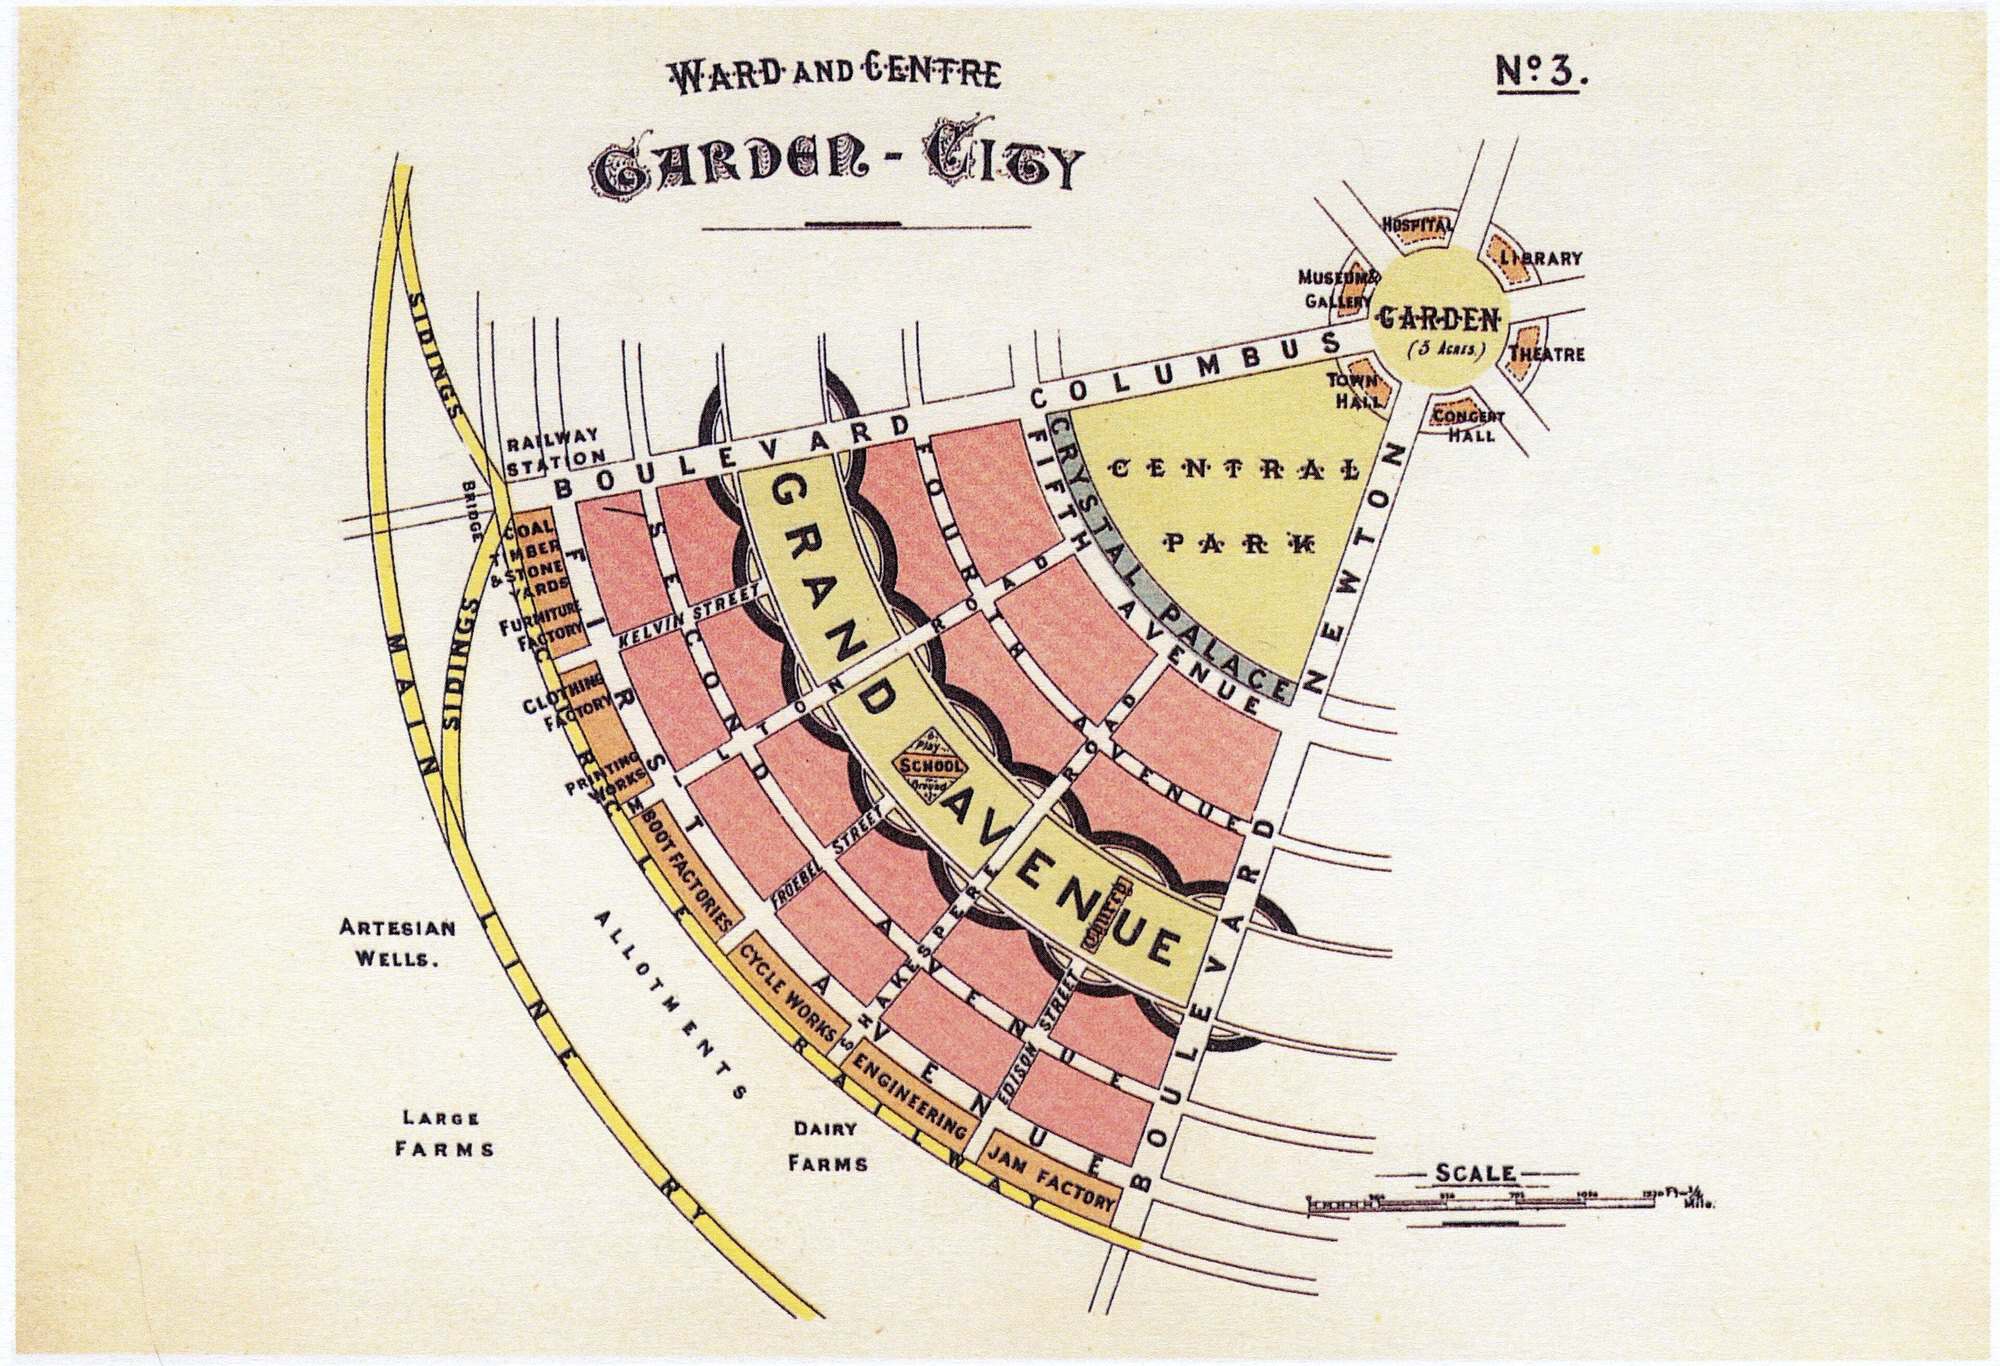
Ebenezer Howard’s diagrams in To-morrow: A Peaceful Path to Real Reform (1898) are the best-known masterplan diagrams ever printed. Diagram No. 3, “Ward and Centre”, shows one sixth of his Garden City: a central garden, a ring of public buildings, a Grand Avenue of schools and churches, housing plots in pink, and the railway and farms on the edge. Howard was explicit that it was a diagram only, and that a real plan would depend on the site chosen.
How to do it: Use simple geometry (rings, sectors, bands) to show relationships, not real shapes. Give each use one flat colour, label directly on the drawing and mark it not to scale. Our architectural diagram styles guide shows how the same approach works on single buildings.
3. Colour-coded land-use framework plan
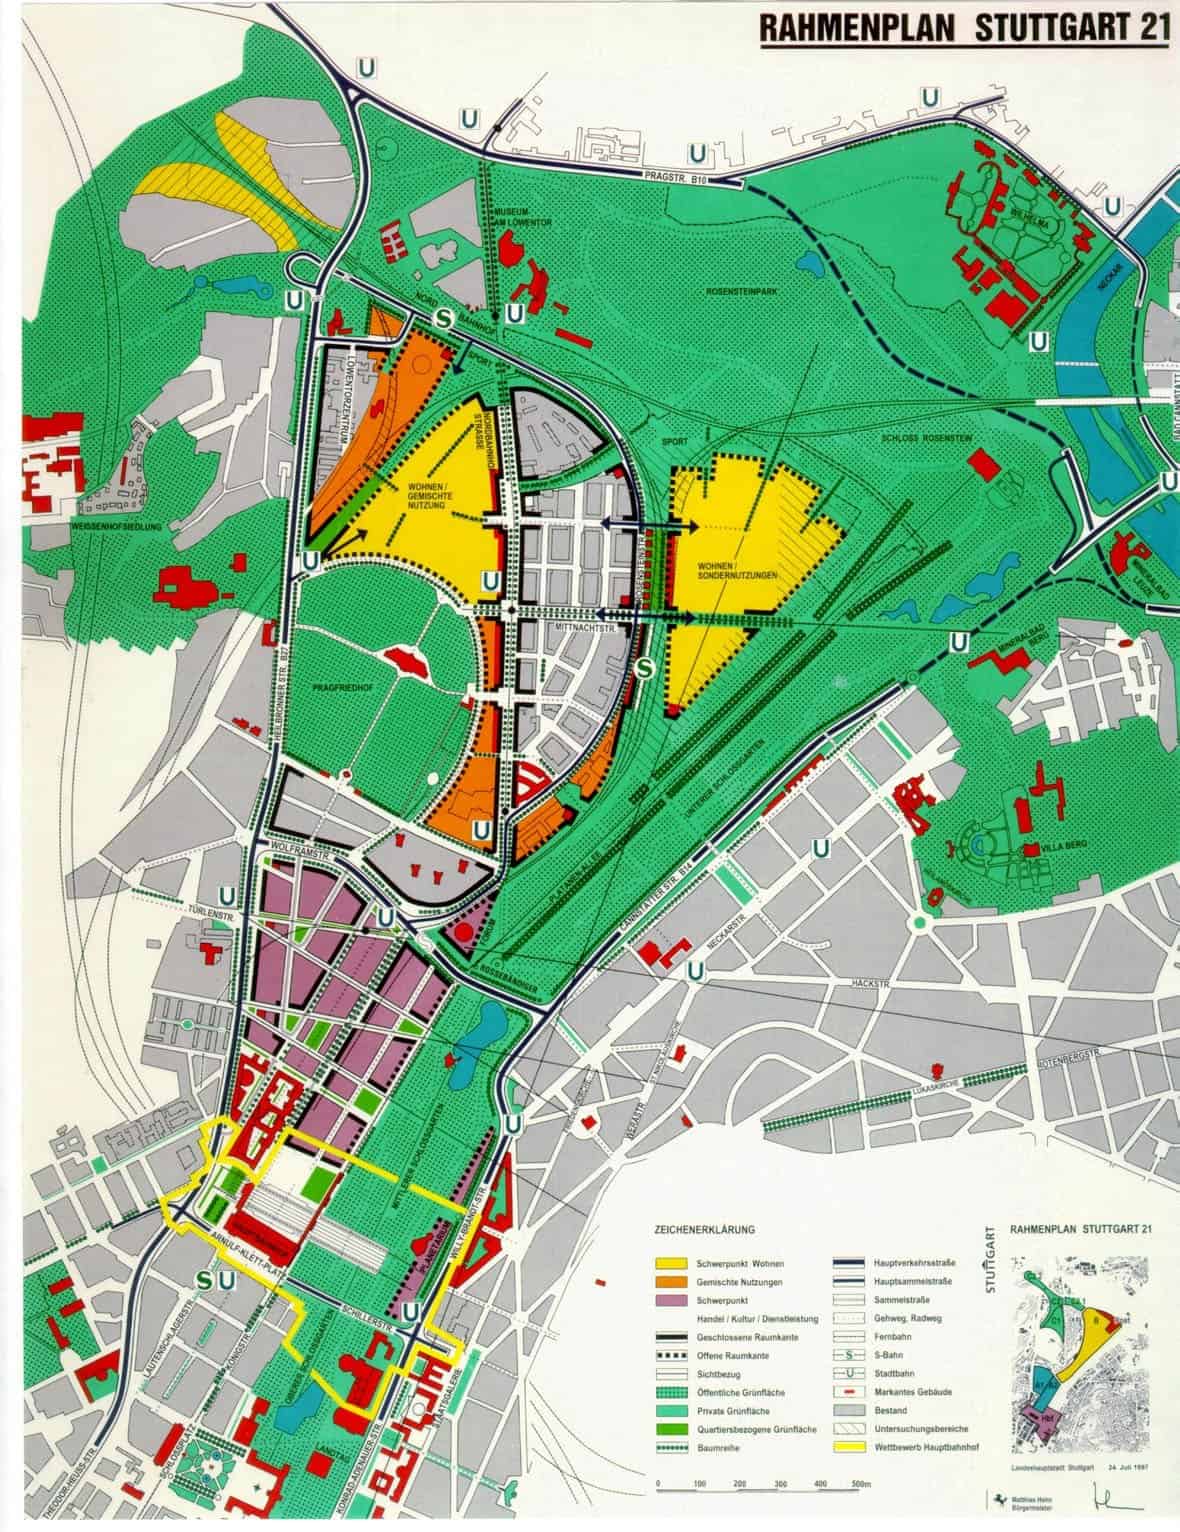
The land-use plan is the core statutory drawing of most masterplans. Stuttgart’s Rahmenplan (framework plan) for the Stuttgart 21 rail project, adopted by the city council on 24 July 1997, shows the land freed up by putting the main station underground. Yellow marks housing focus areas, orange mixed use, purple the commercial and cultural core, and two greens separate public and private open space. Existing buildings stay grey and landmark buildings are picked out in red.
How to do it: Use a consistent colour convention (yellow for residential, red or purple for commercial, blue for civic and green for open space are common) and put the existing city in neutral grey. Draw boundaries as crisp lines over the fills and keep the legend on the same sheet.
4. Massing plan with cast shadows
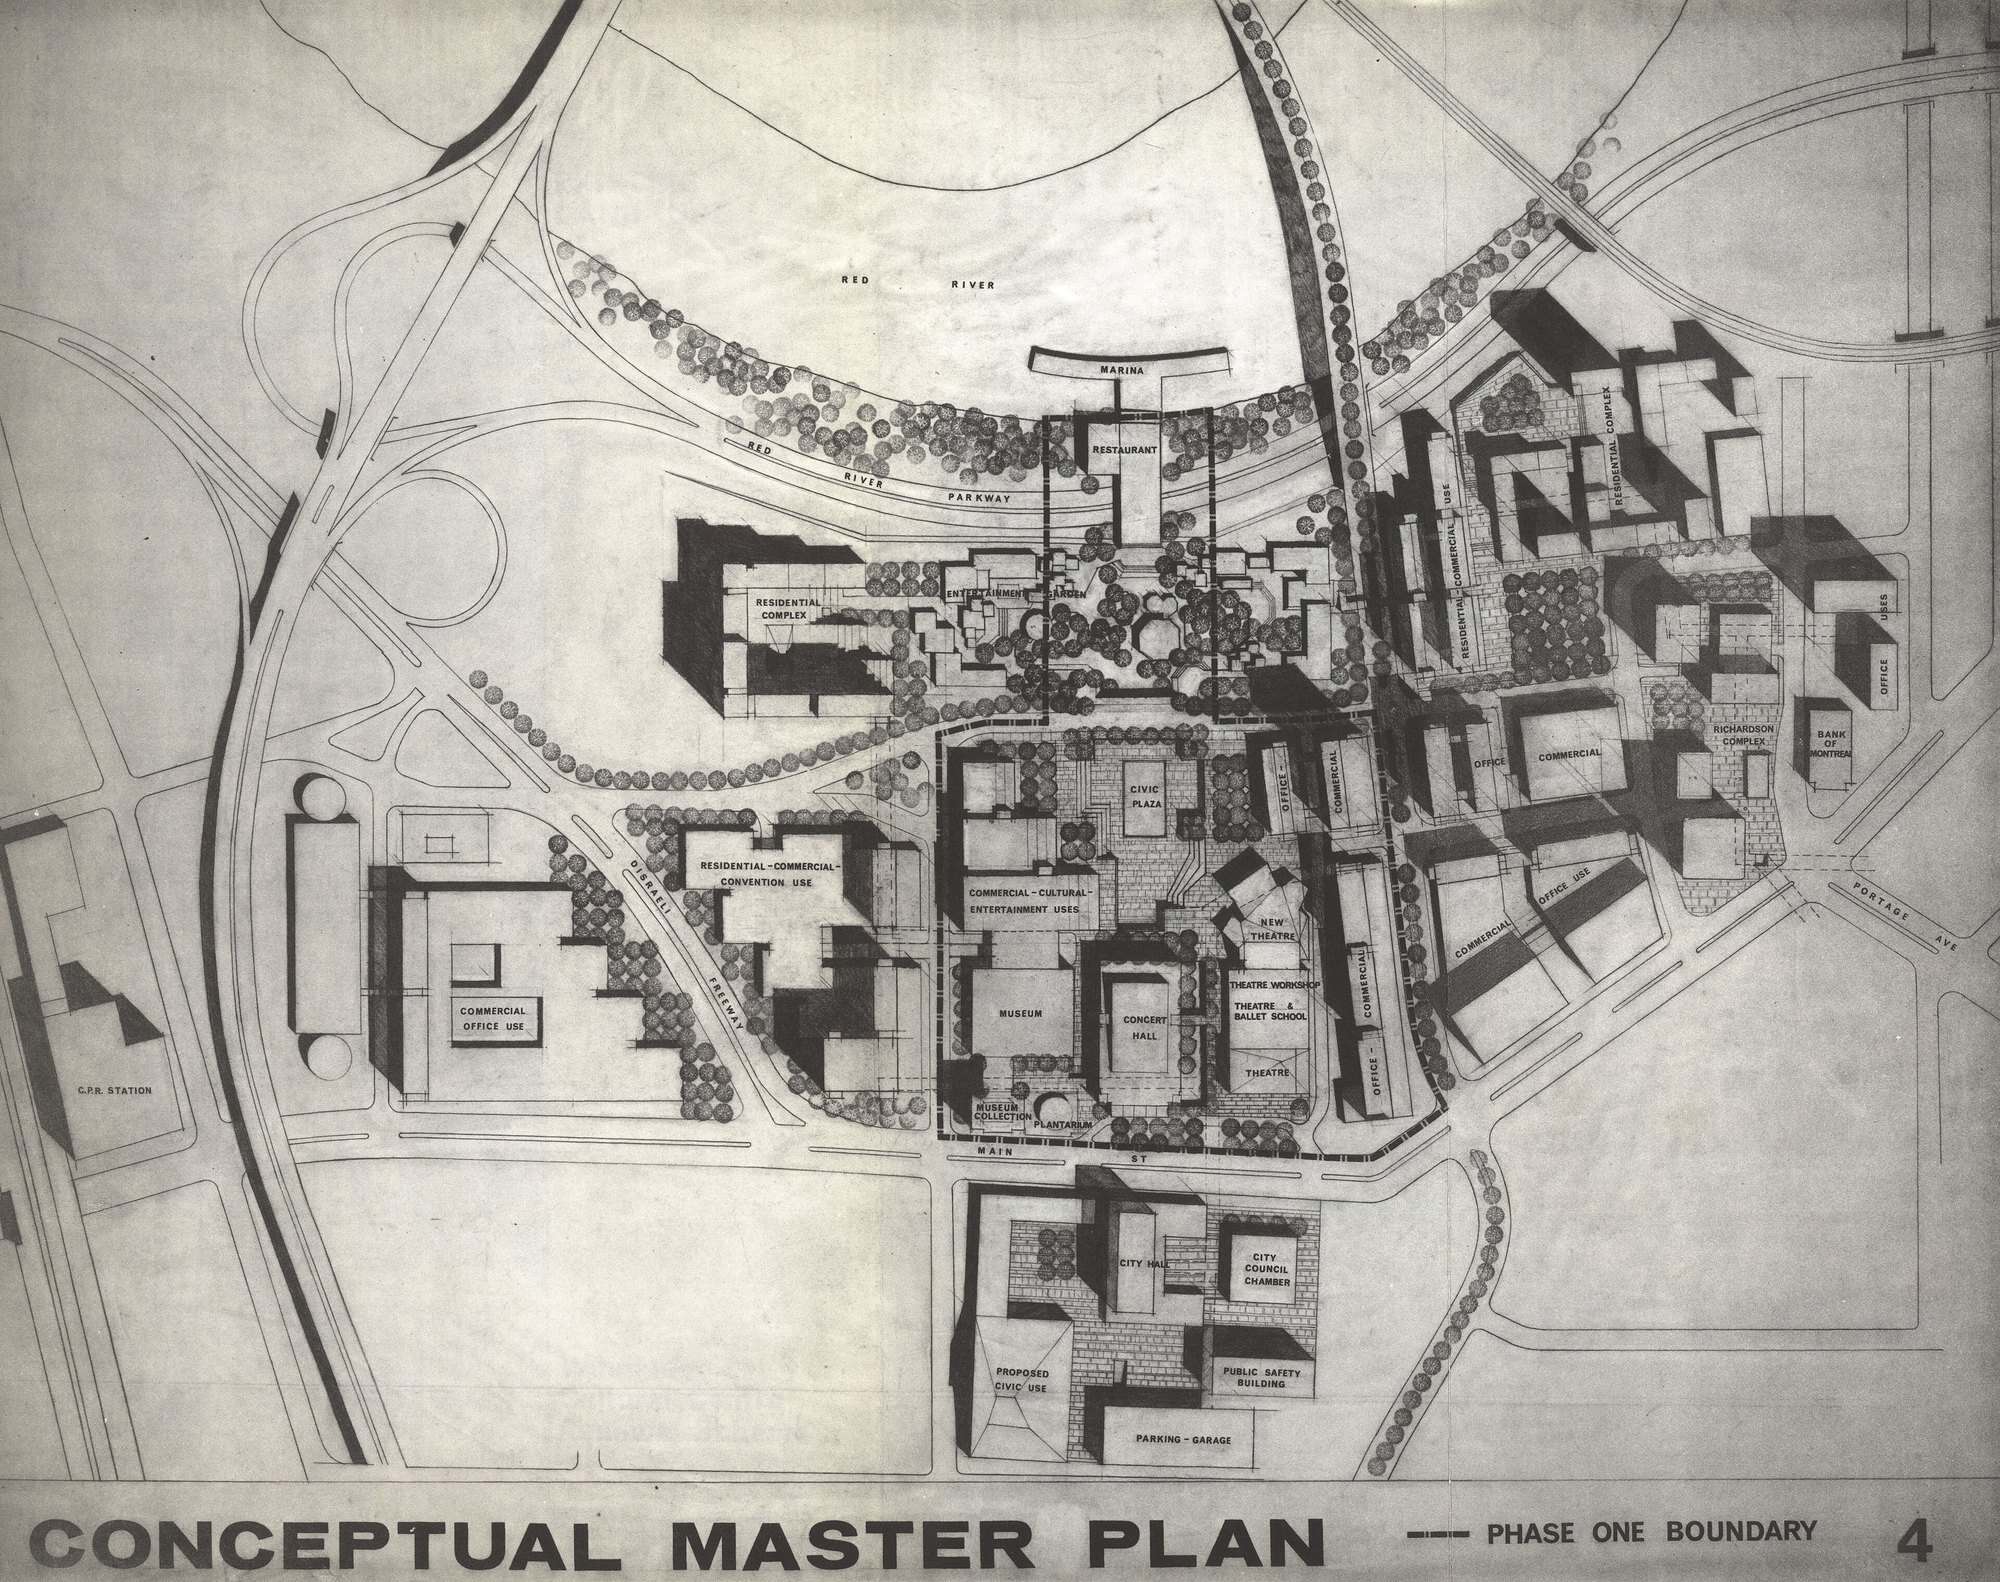
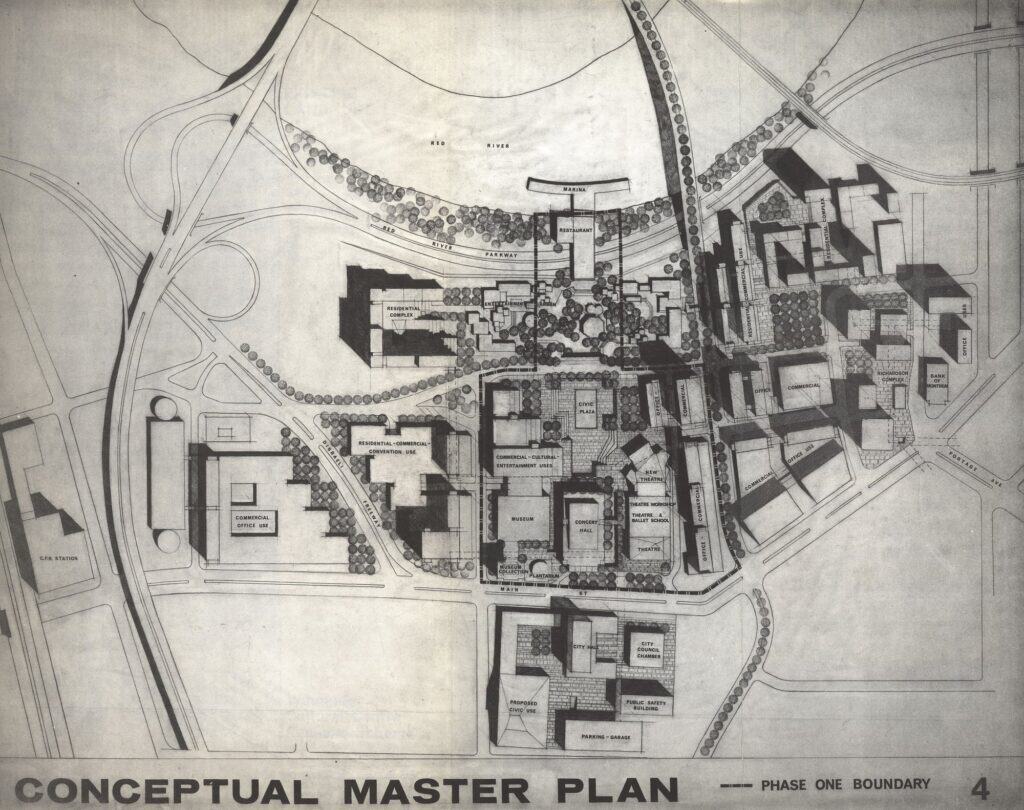
A massing plan shows the height and bulk of buildings in plan view, usually with shadows. This 1967 Conceptual Master Plan for Winnipeg’s downtown cultural centre renewal area, prepared by Co-Ordinating Architects and Planners for the City of Winnipeg, shows towers, podiums and slabs with long shadows, so you can read heights without a single number. A line marks the phase one boundary.
How to do it: Model the blocks in SketchUp or Rhino, set one consistent sun angle and export a top view. Keep proposed buildings light and existing ones grey. For 3D views of the same model, see our axonometric drawing styles.
5. Phasing plan
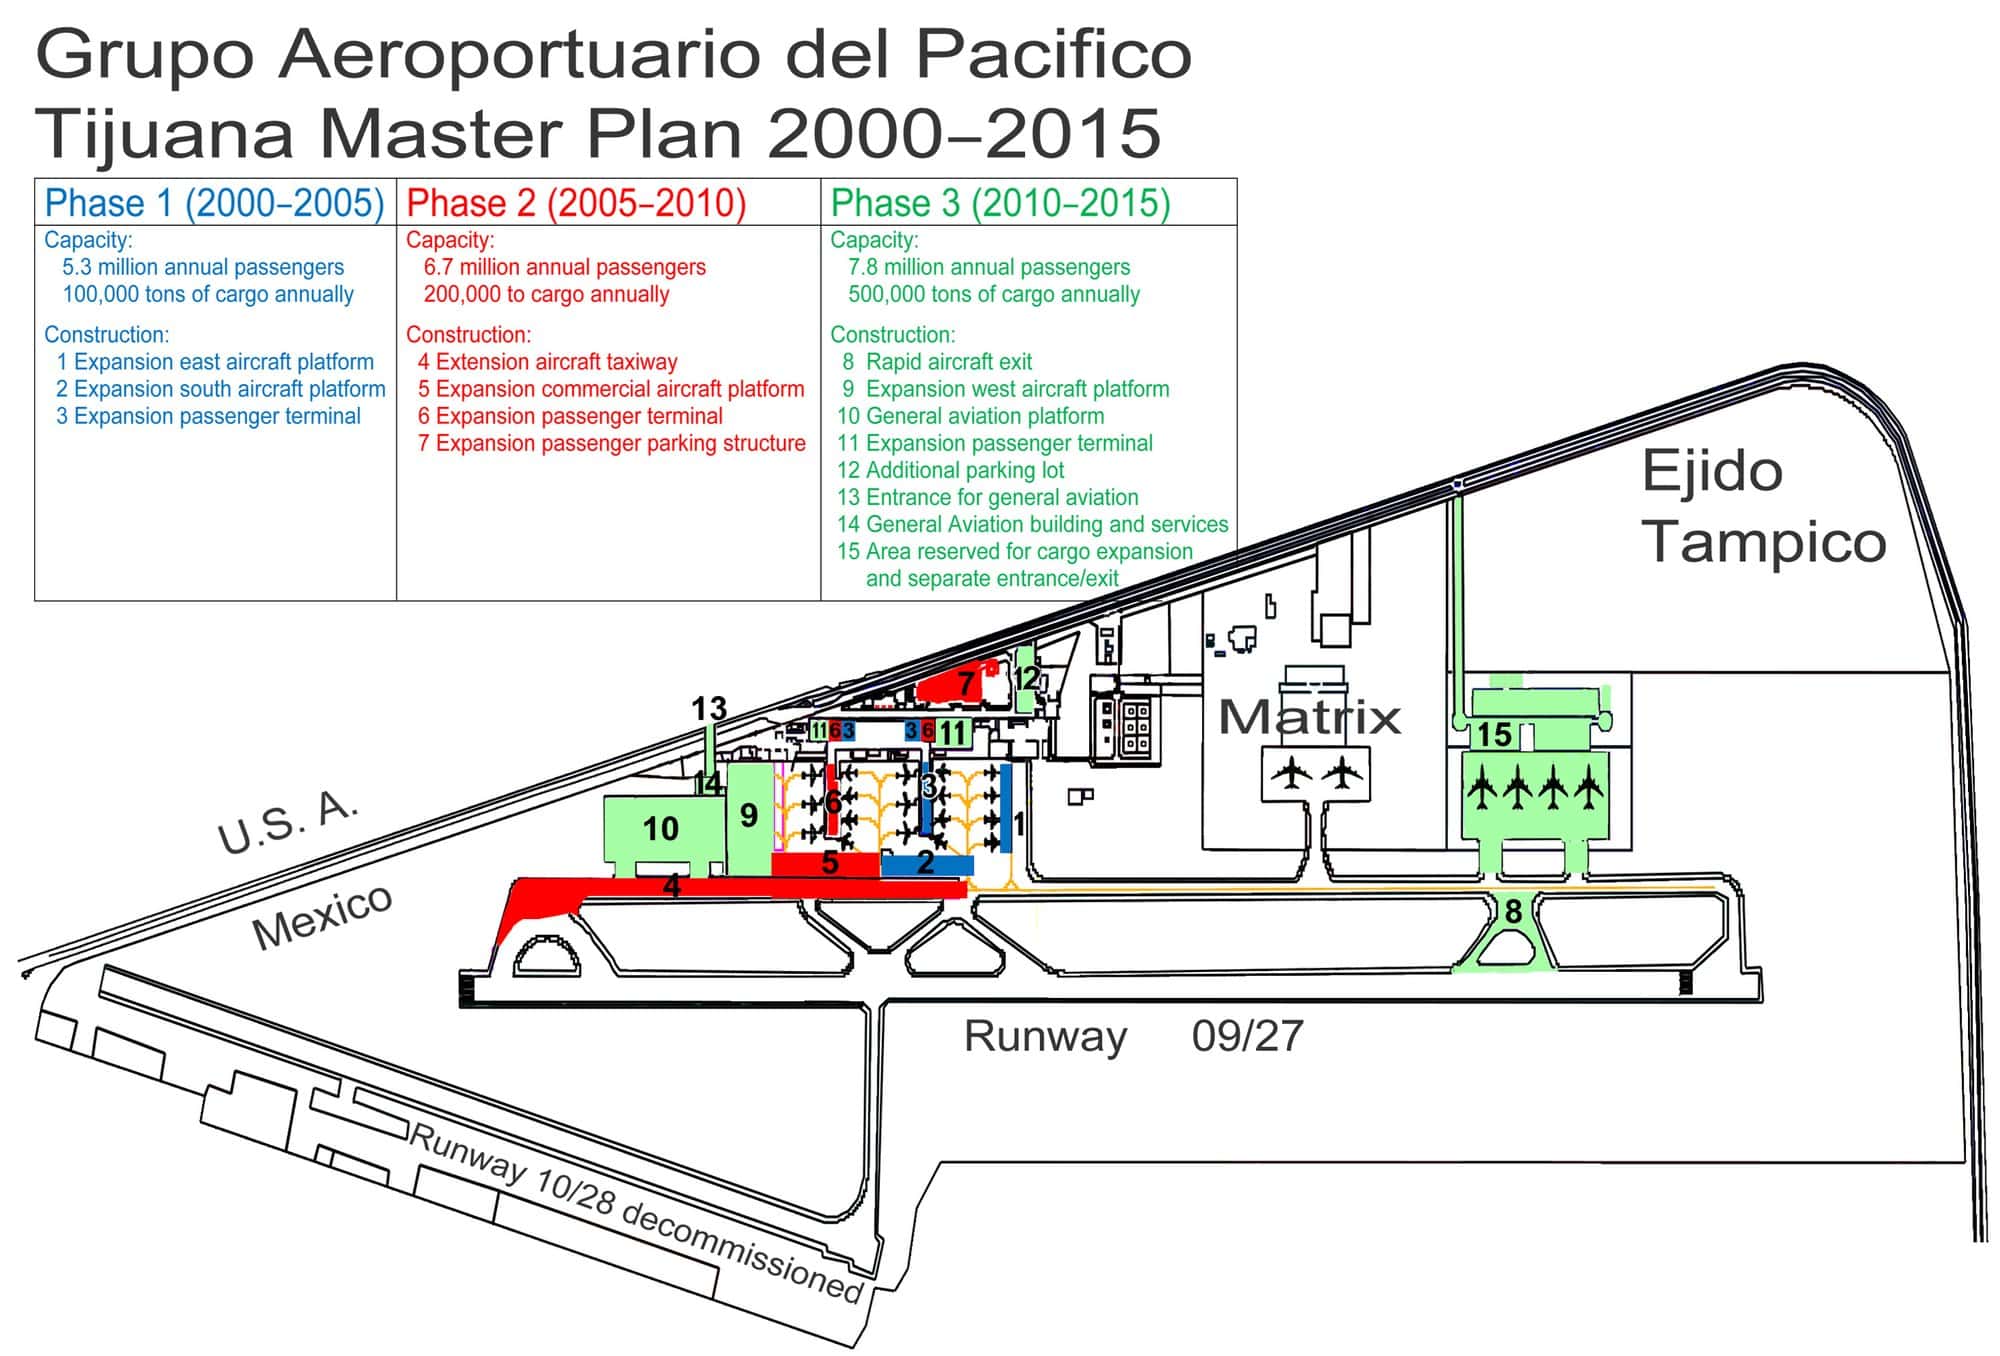
Large masterplans are built over decades; the phasing plan shows what happens when. This redrawn version of the 2000–2015 masterplan proposed for Tijuana International Airport colour-codes three five-year phases (blue, red and green) and numbers each project, with a table explaining what each phase delivers. Airports are classic phased masterplans: Foster + Partners’ masterplan for King Salman International Airport in Riyadh and the future phases planned at Techo International Airport in Phnom Penh work the same way.
How to do it: Use one colour per phase across every drawing in the set, and number projects in a table on the sheet. A series of small plans, one per phase with earlier phases greyed out, often reads better than one crowded plan.
6. Figure-ground plan
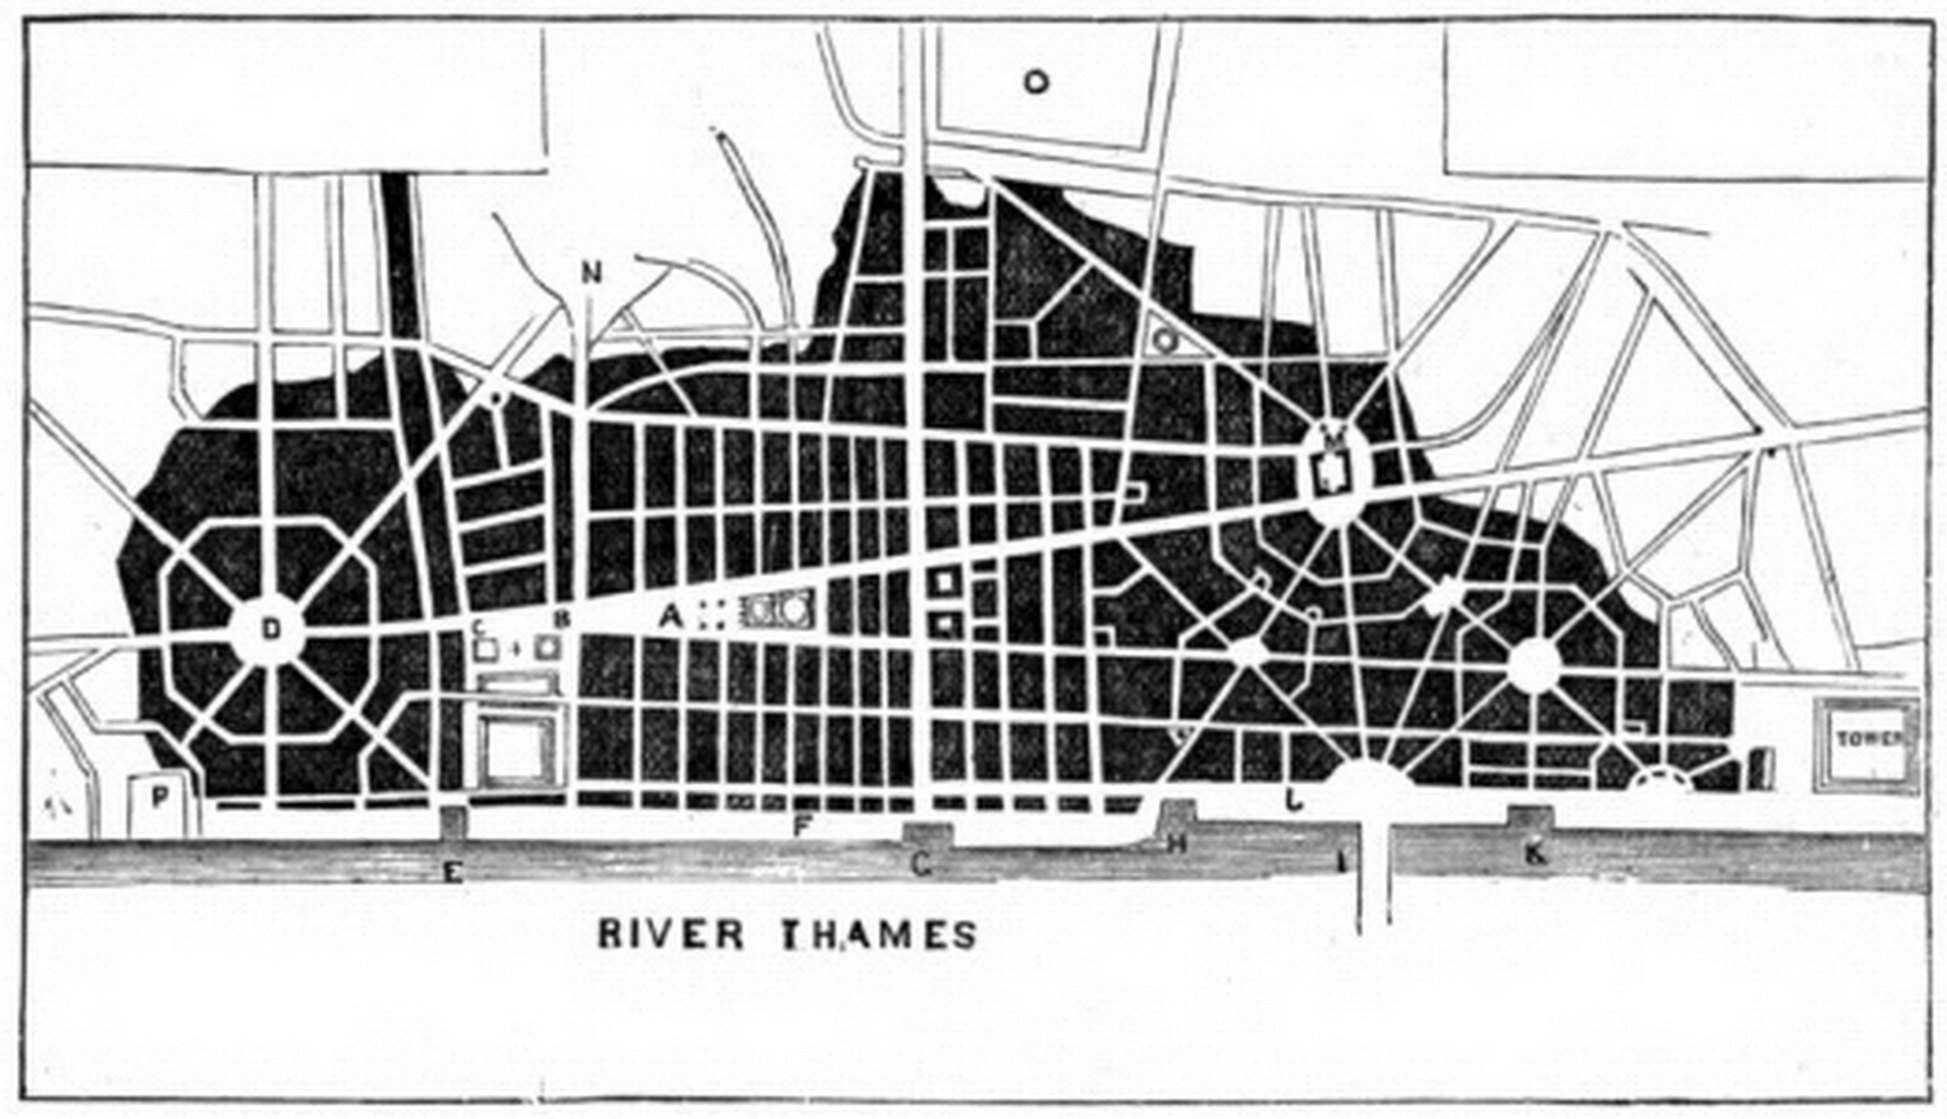
A figure-ground plan shows built areas in solid black and open space in white, so the pattern of streets and squares jumps out. This 1865 redrawing from Cassell’s Illustrated History of England shows Christopher Wren’s plan for rebuilding the City of London after the Great Fire of 1666: straight avenues, circular piazzas where streets meet, and a wide quay along the Thames. It was never built, but in black and white its intentions are obvious.
How to do it: Fill every footprint or block in black and leave streets, squares and water white. Put existing and proposed versions side by side at the same scale; the comparison is often a masterplan’s strongest argument.
7. Movement and street network diagram
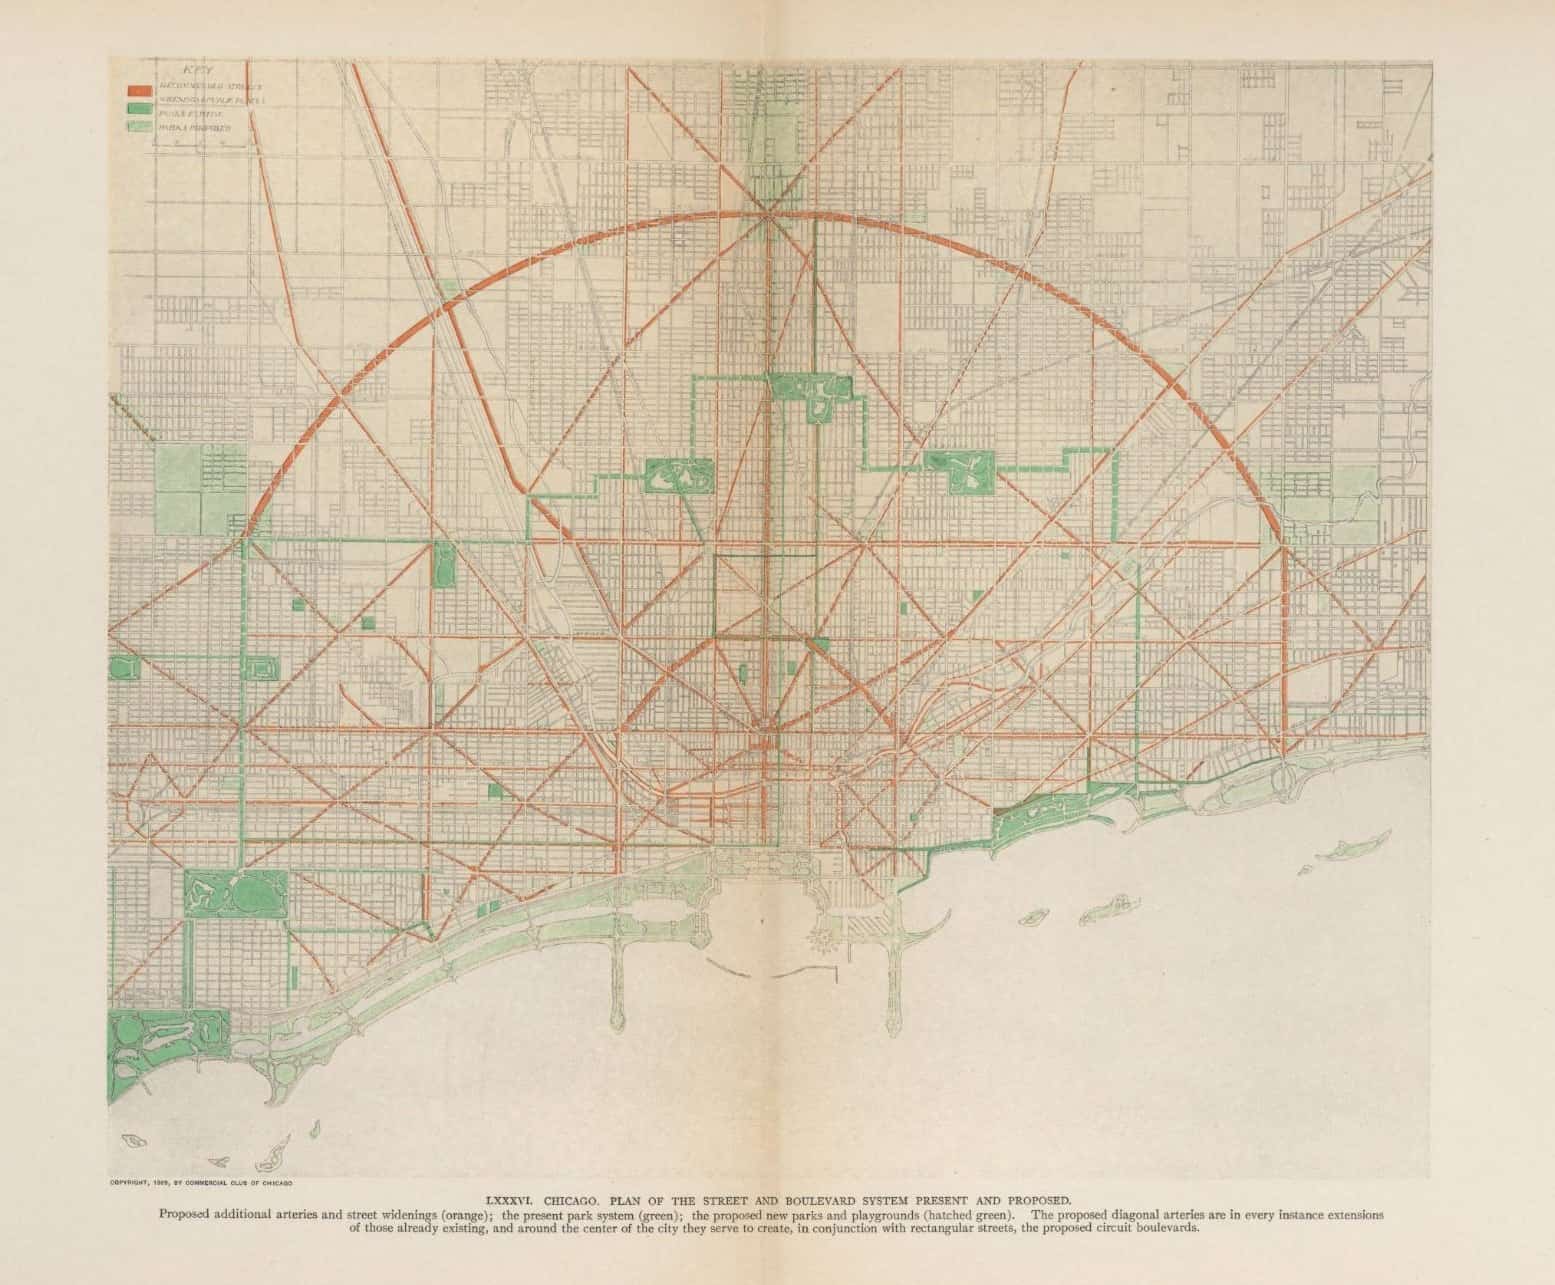
Daniel Burnham and Edward Bennett’s Plan of Chicago (1909) contains one of the clearest movement diagrams in planning history. Plate LXXXVI, “Plan of the street and boulevard system present and proposed”, shows new and widened arteries in orange laid over the grey existing grid, the park system in green, and proposed parks in hatched green. Diagonal avenues cut across the grid, and a great semicircular boulevard ties them together around the centre.
How to do it: Put the existing streets in faint grey and draw proposed routes in one strong colour, with line weights showing their hierarchy. Give transit, cycling and walking their own plans if they would tangle.
8. Aerial perspective in watercolour
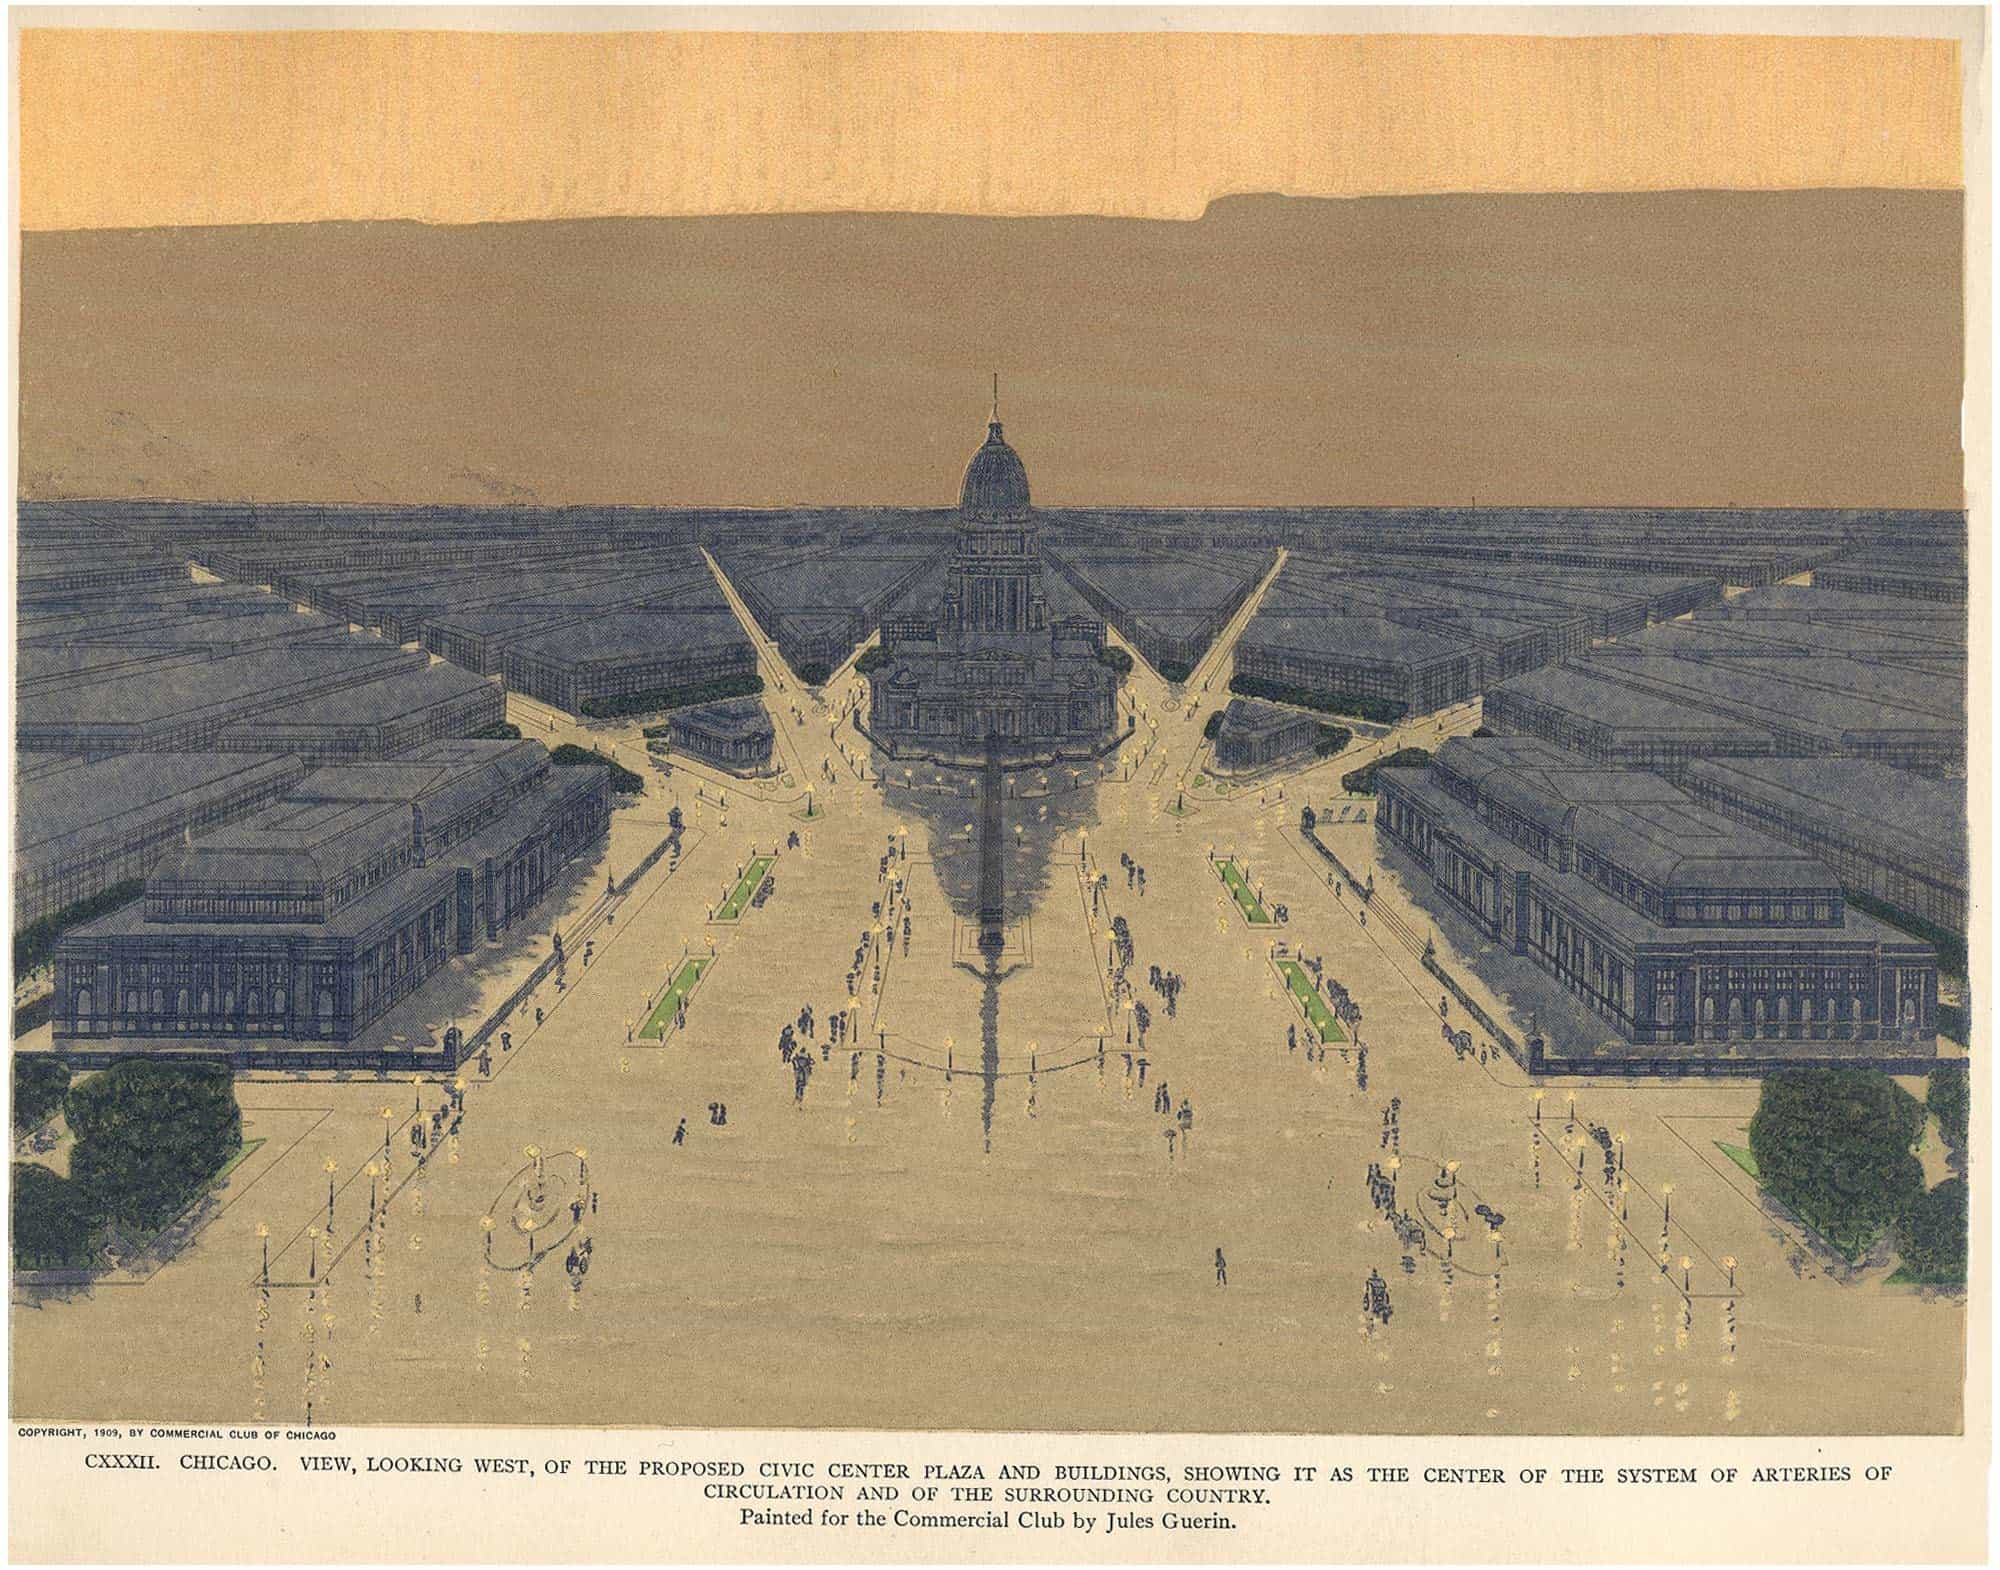
Burnham hired the painter Jules Guérin to make the Plan of Chicago persuasive, and his aerial views still shape how masterplans are presented. Plate CXXXII looks west over the proposed Civic Center plaza, with a domed civic building at the meeting point of diagonal avenues, flanked by matching blocks of public buildings. The muted blue-grey city and tiny figures make a huge proposal feel calm and inevitable.
How to do it: Set a high aerial view on the main axis of a simple 3D model and paint over it in watercolour or a limited digital palette, keeping the surrounding city in one flat tone. Our architectural rendering styles post covers the digital equivalents.
9. Rendered competition presentation drawing
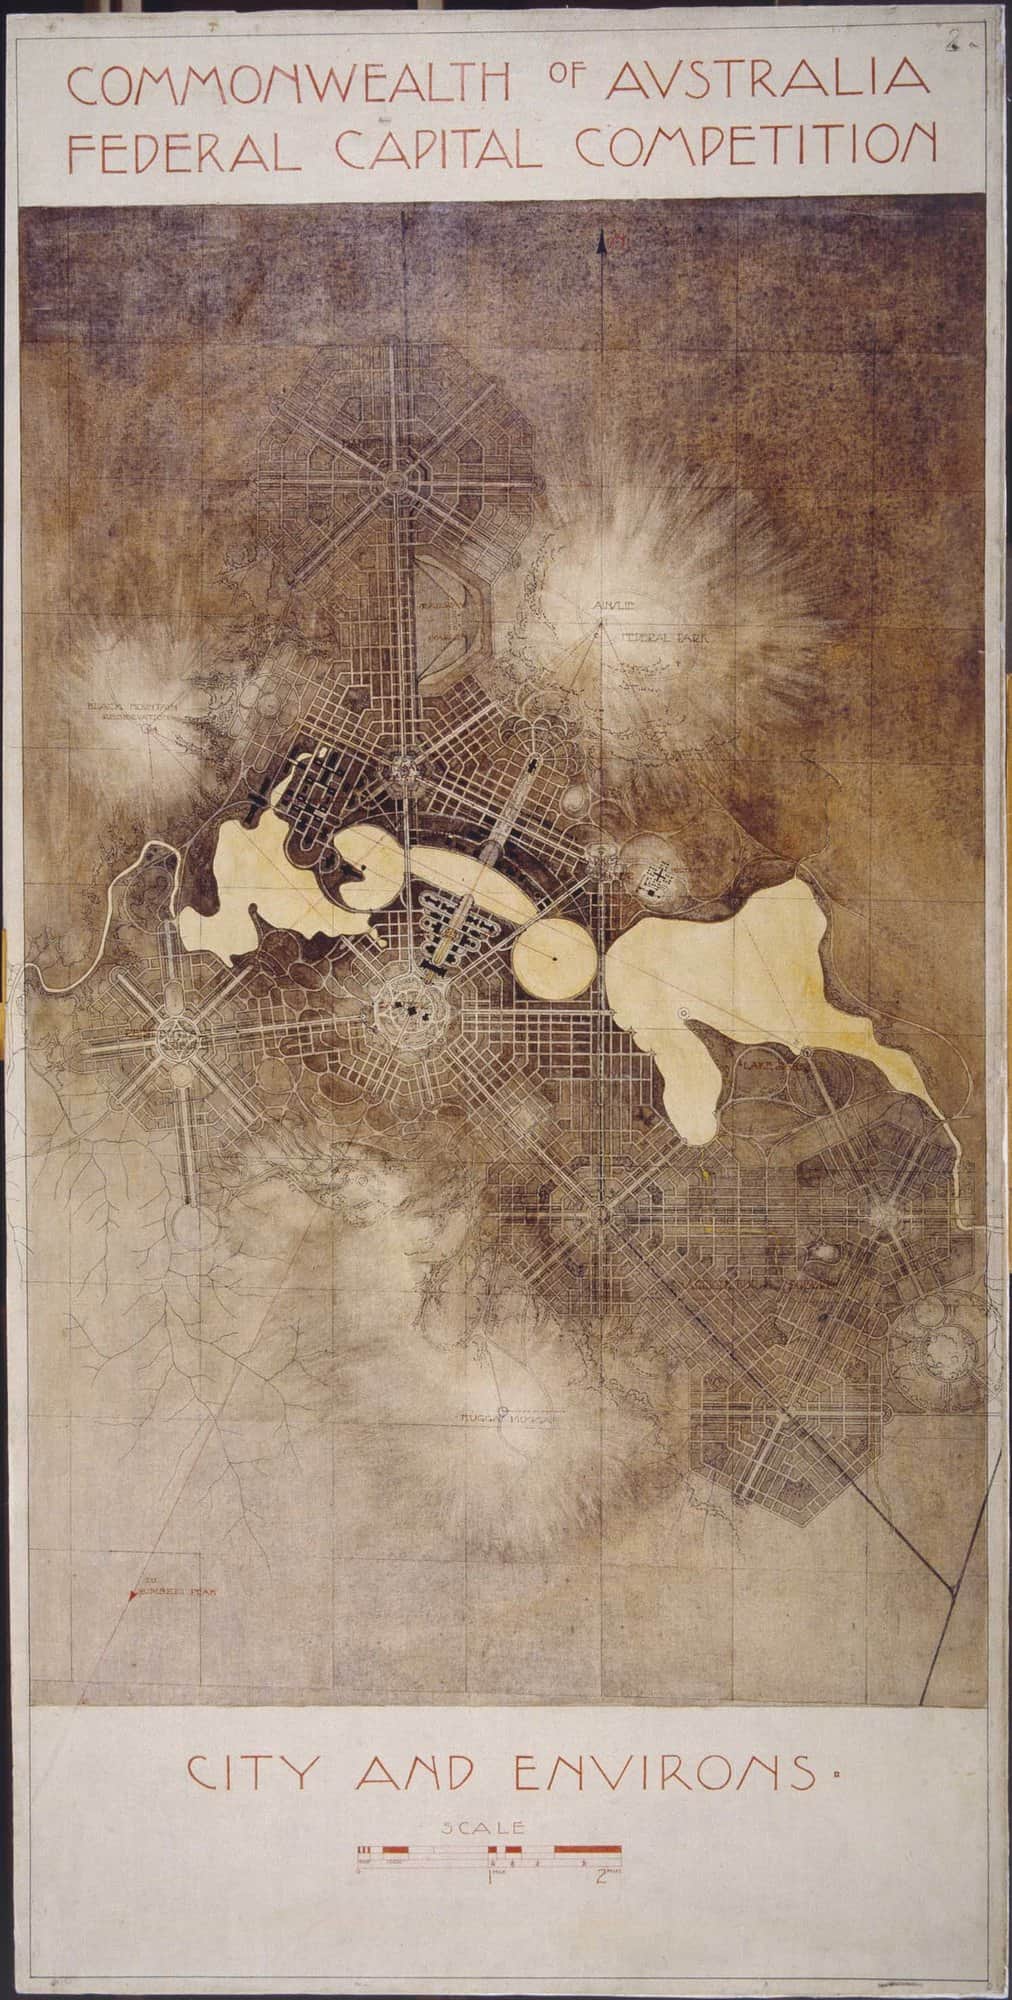
Walter Burley Griffin won the Federal Capital Design Competition in 1912 with a set of drawings rendered by Marion Mahony Griffin. “City and Environs” shows Canberra’s plan in pale ink on a dark, shaded ground: geometric avenues and the land axis linking the hills, with the lake basins in light tones at the centre. The original sheets are held by the National Archives of Australia.
How to do it: Pick one strong graphic idea for the main competition sheet and hold it across the set. A dark ground with the plan in light lines carries well on a wall, and landform shown as tone lets a jury see the city in its landscape. Our presentation board layouts post shows how to compose the full set.
10. Ink block-and-lot plan
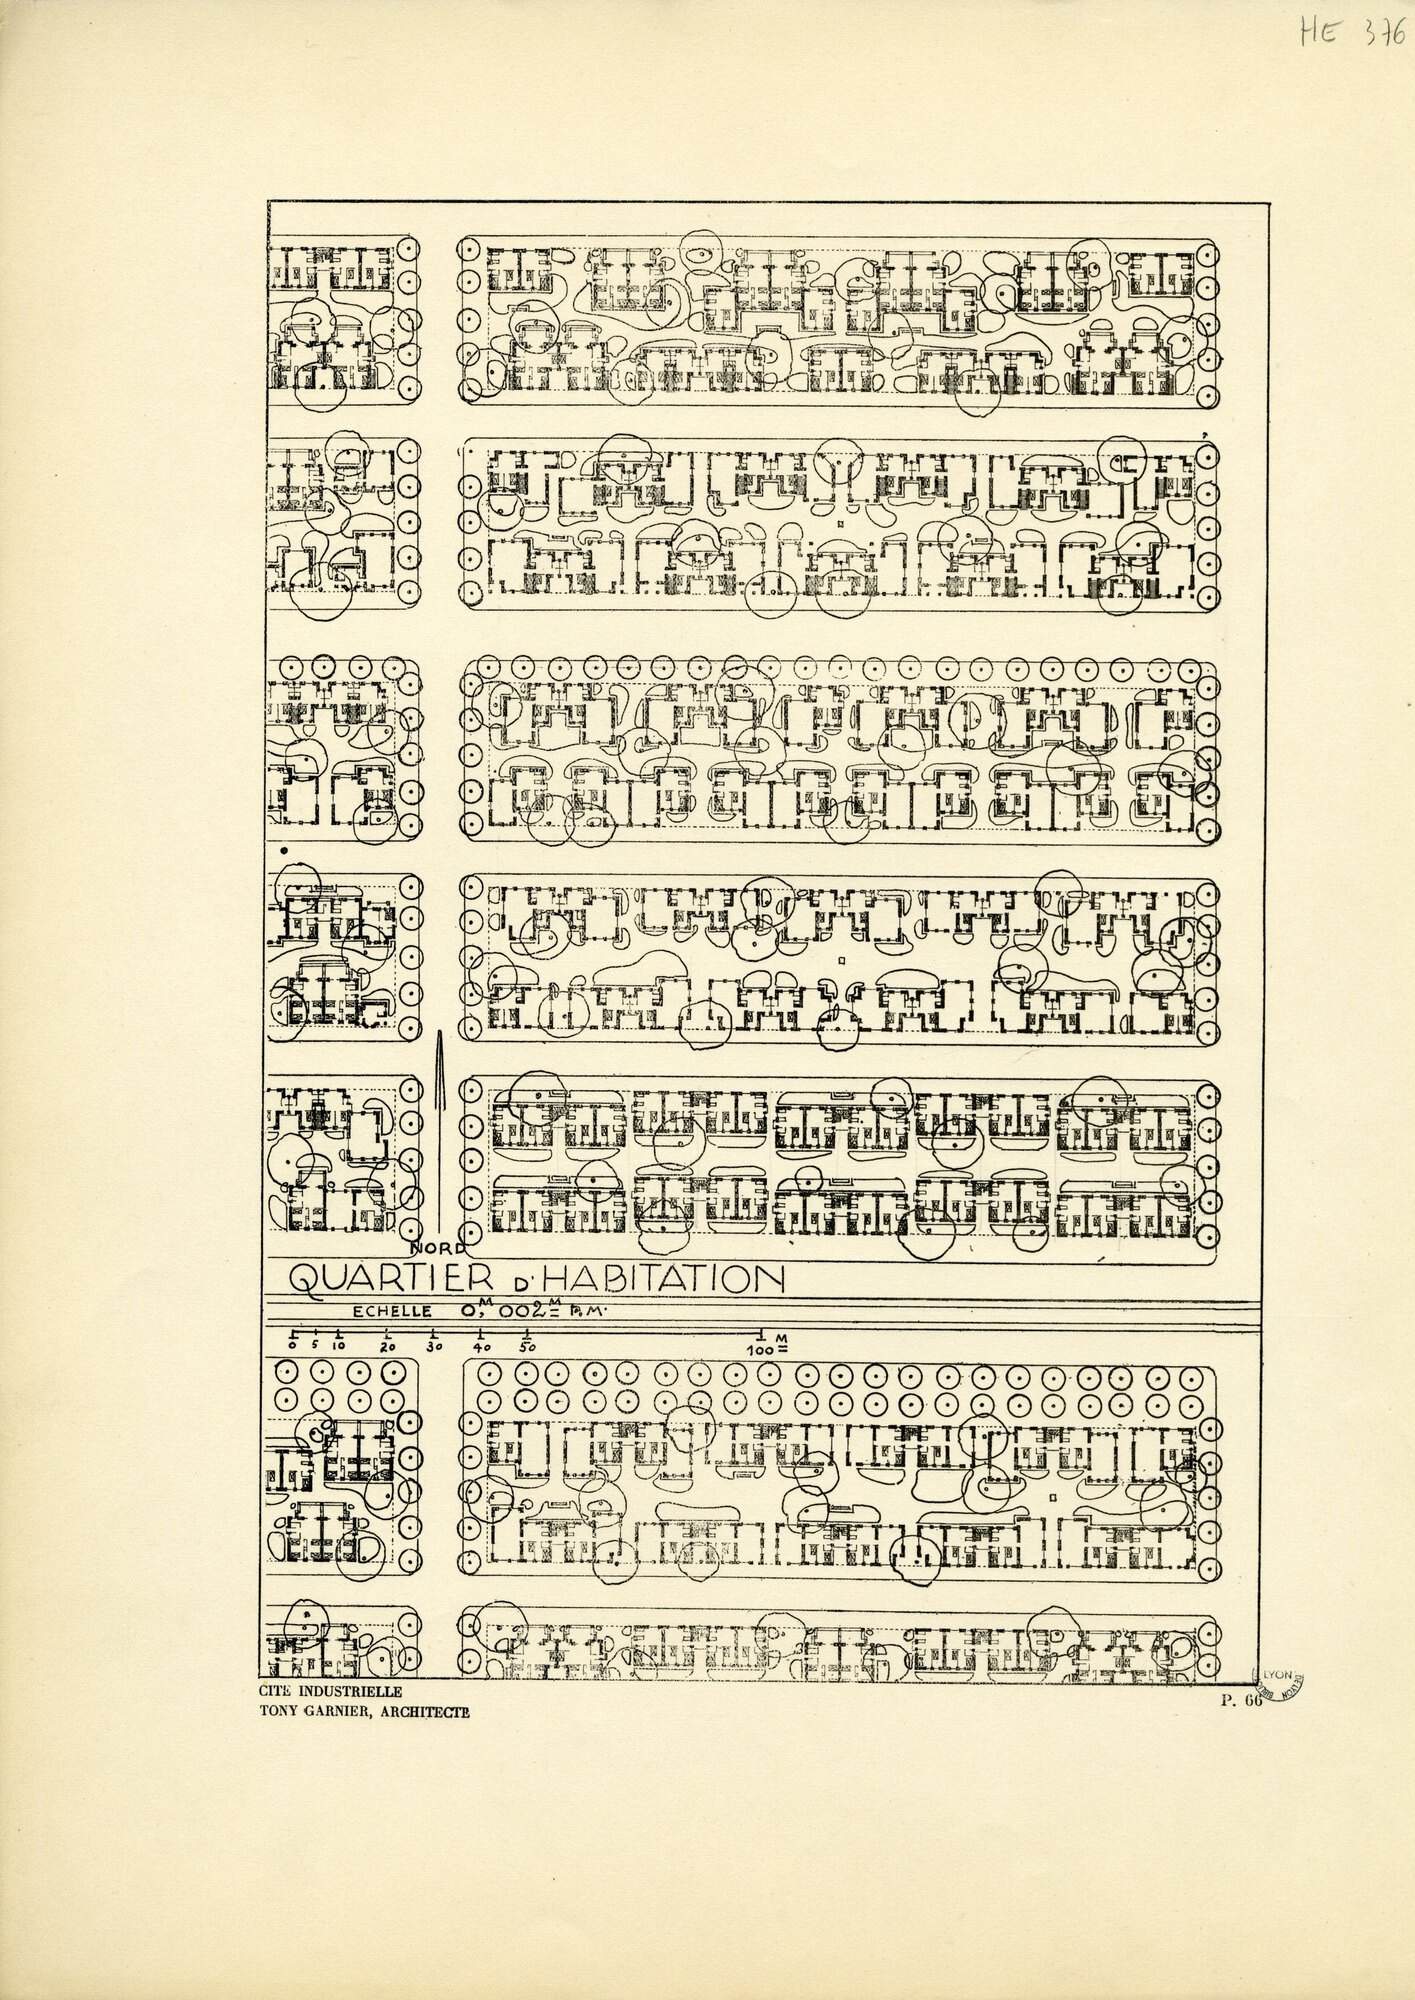
Tony Garnier’s Une cité industrielle, first drawn in the early 1900s and published in 1917, is a complete imaginary city drawn down to individual houses. Plate 66 shows a residential quarter: long narrow blocks divided into lots, each house footprint drawn in fine ink with its garden and trees, and footpaths running through the blocks. Garnier’s rule that buildings cover less than half of each lot is visible in every block.
How to do it: Once a masterplan sets plot sizes and building rules, draw one or two typical blocks at a larger scale with footprints, trees and paths. One line weight and simple tree circles keep it clean.
11. Grid extension plan
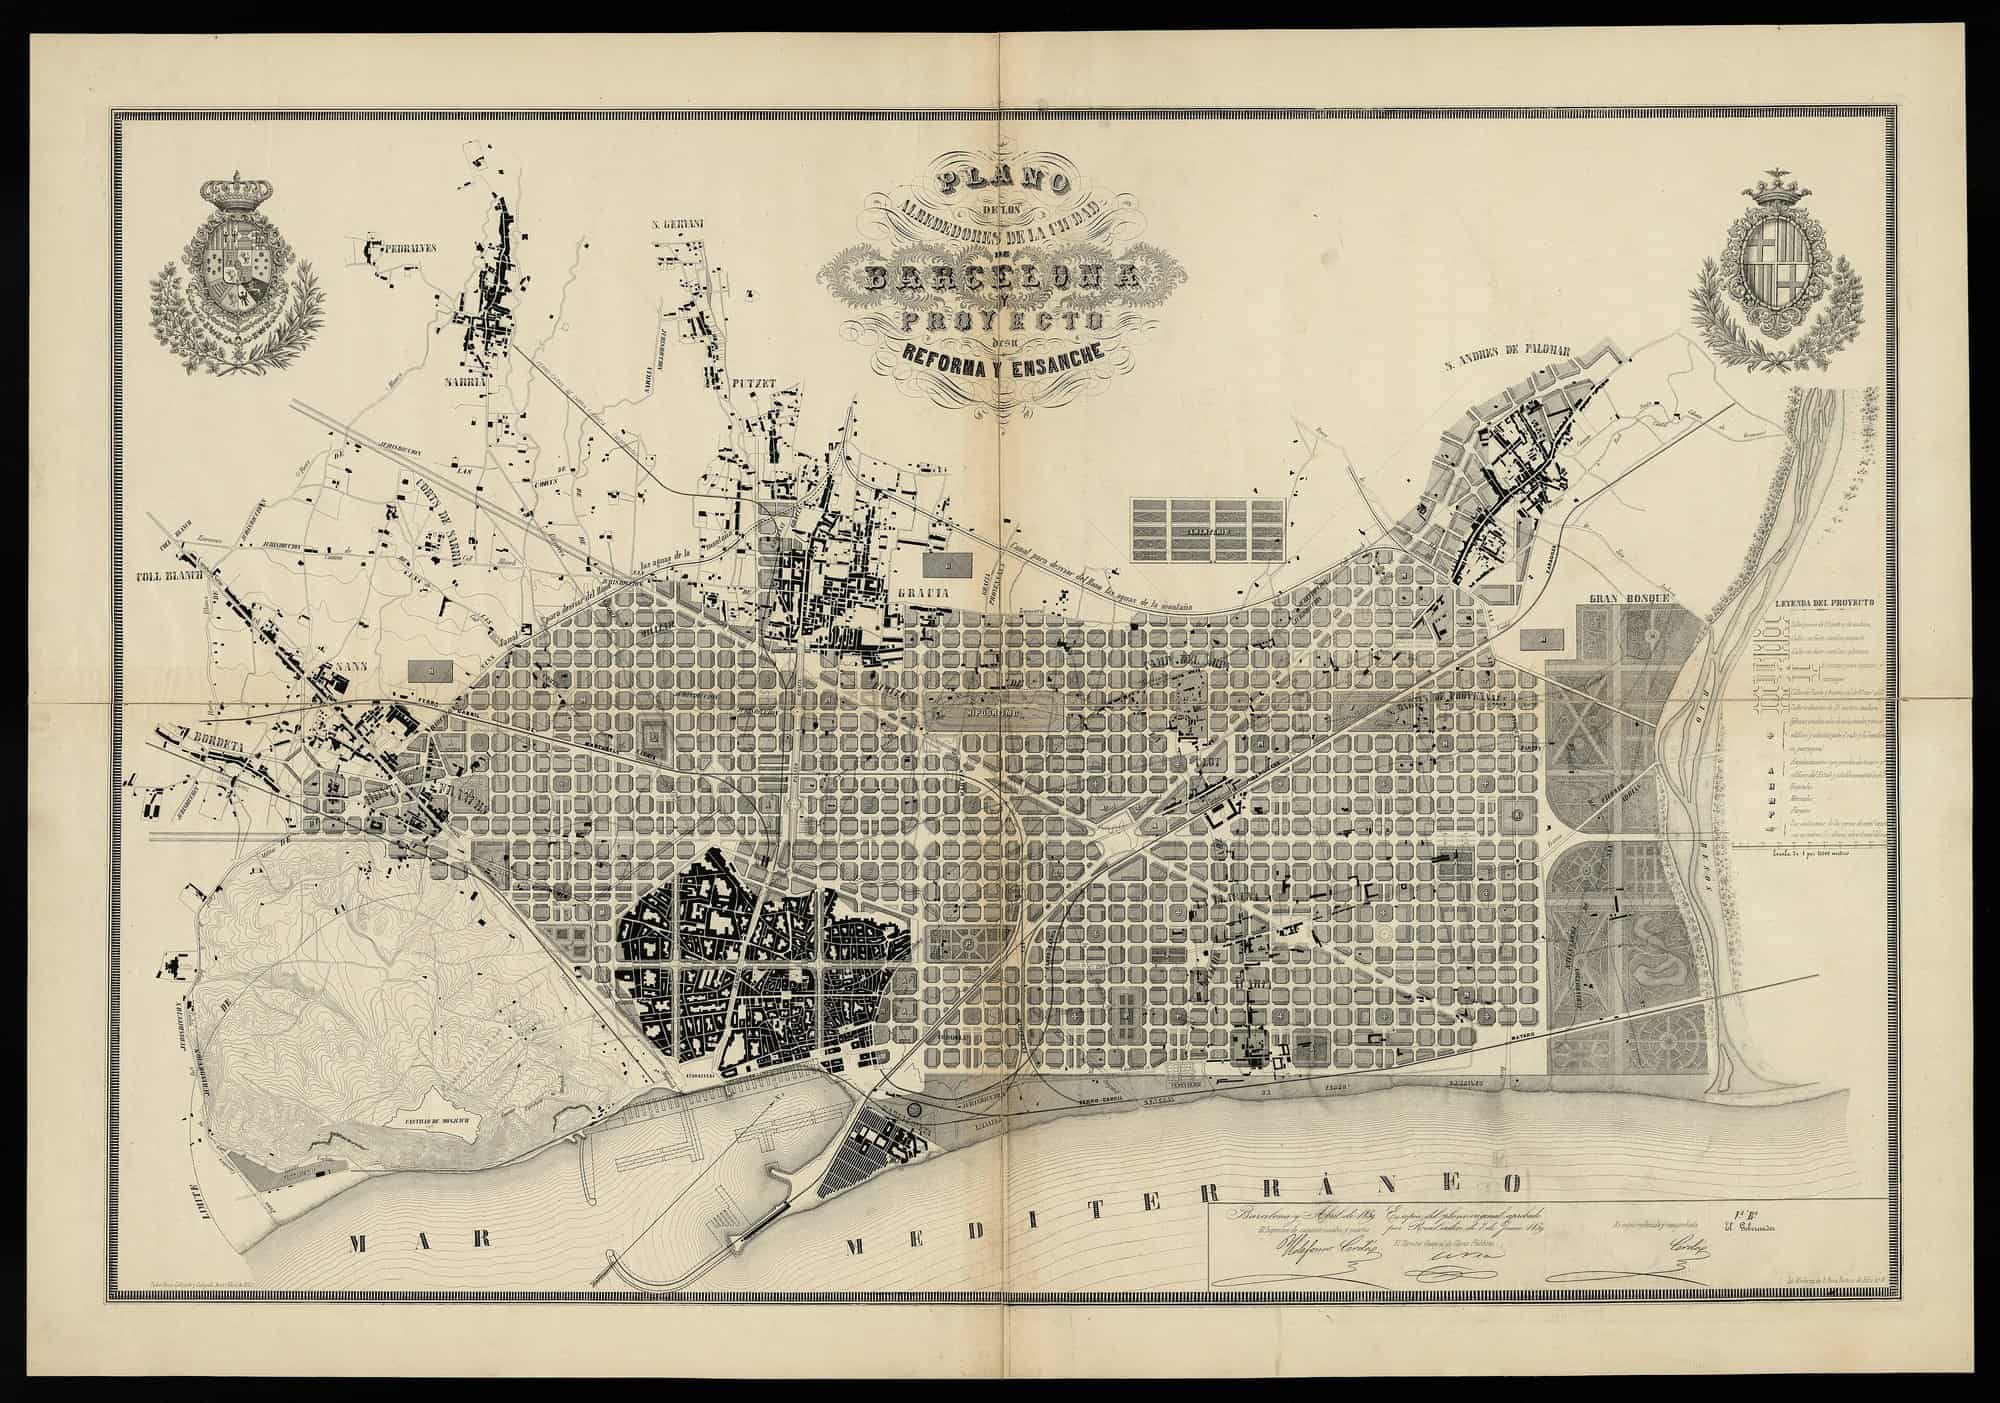
Ildefons Cerdà’s 1859 plan for the Eixample (extension) of Barcelona is a masterplan that set the shape of a modern city. Outside the dense old town, shown in black, a vast grid of square blocks with cut corners spreads across the plain, crossed by the long diagonal avenues of the Diagonal and the Meridiana.
How to do it: For a repeated block, draw the whole grid crisply, use a darker tone for the existing town so the extension reads as new, and add a typical block detail at a larger scale.
12. Development plan over a survey base
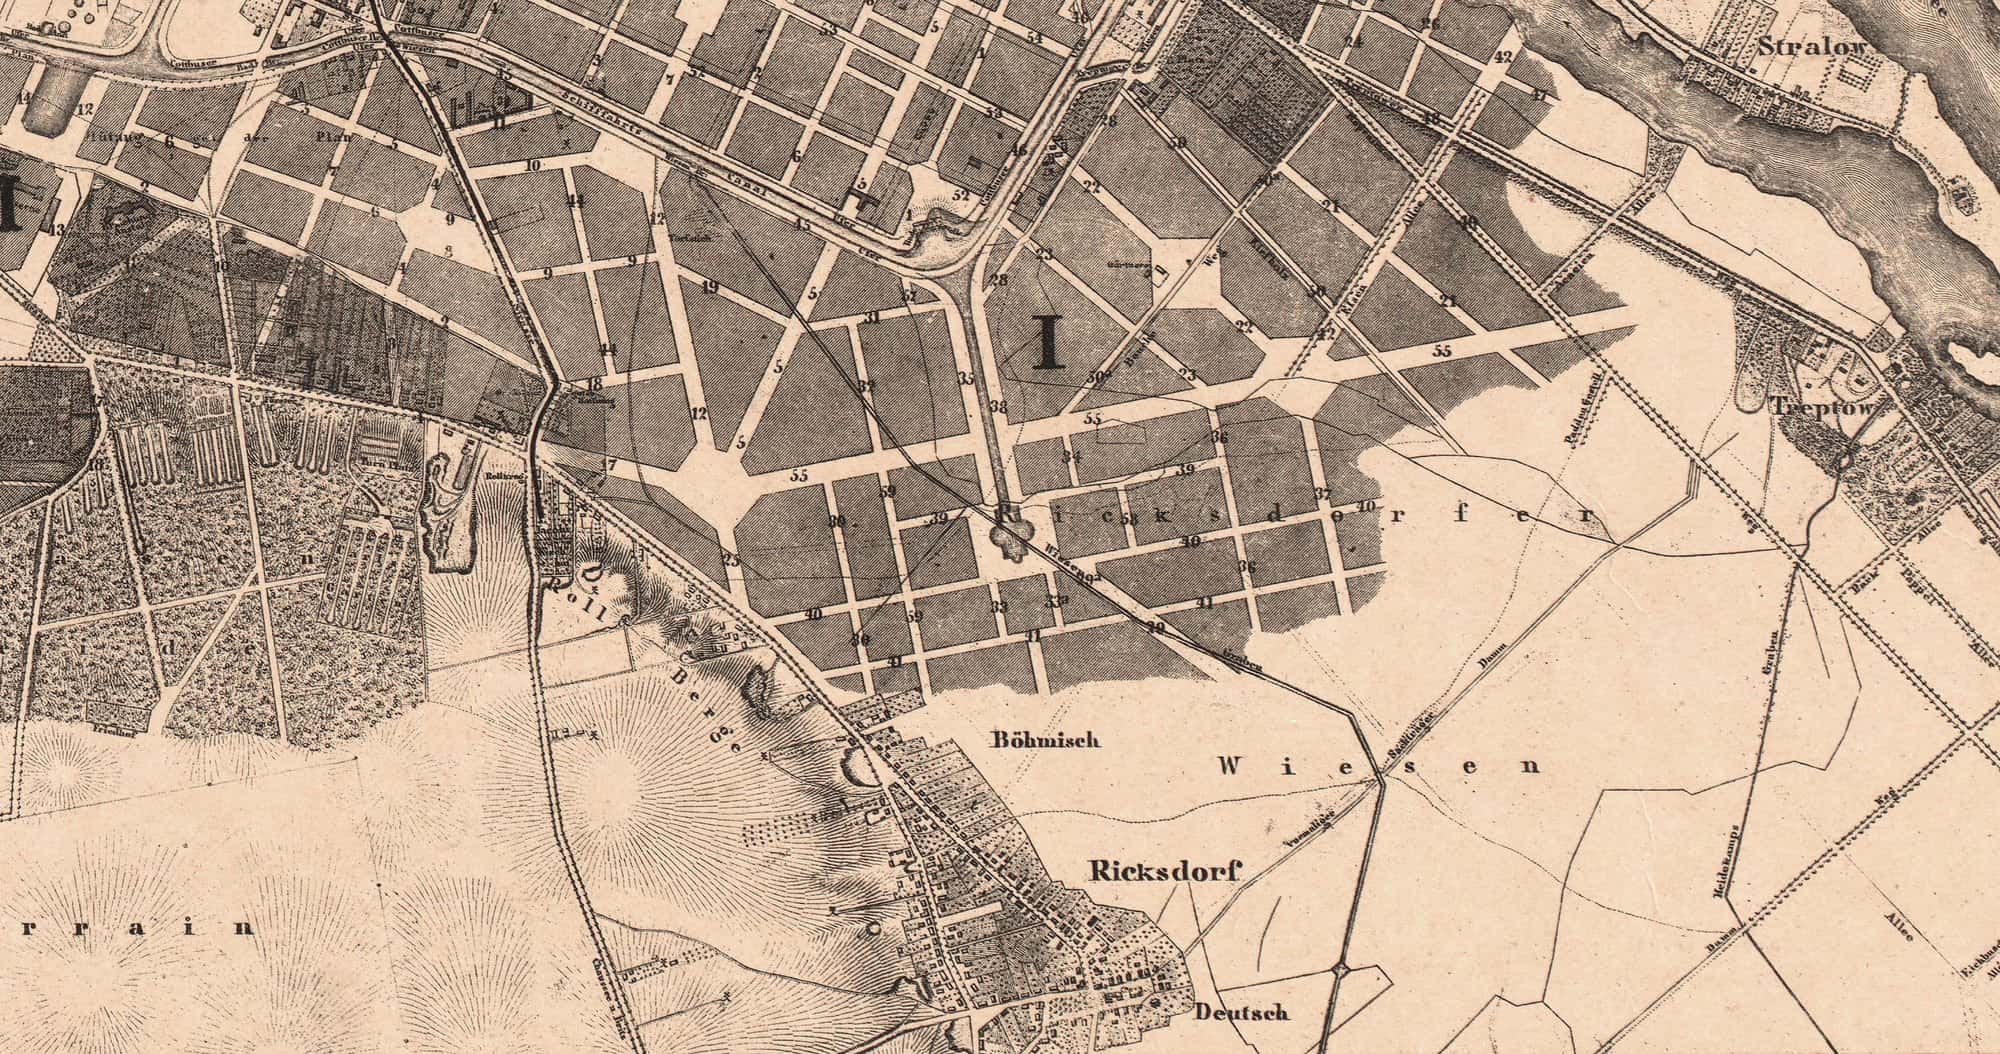
James Hobrecht’s 1862 development plan (Bebauungsplan) for the outskirts of Berlin set the street lines and blocks for decades of growth. This detail from Ferdinand Boehm’s 1862 map, engraved by Wilhelm Bembé, shows the area around Rixdorf (today’s Neukölln): planned blocks in dark tone, numbered by section, laid over the fields, meadows and villages that existed at the time.
How to do it: Put the survey or aerial photo underneath in a pale tone, draw proposed streets and blocks solid on top, and number the blocks so the written controls can refer to them.
13. Survey-based town plan with parklands
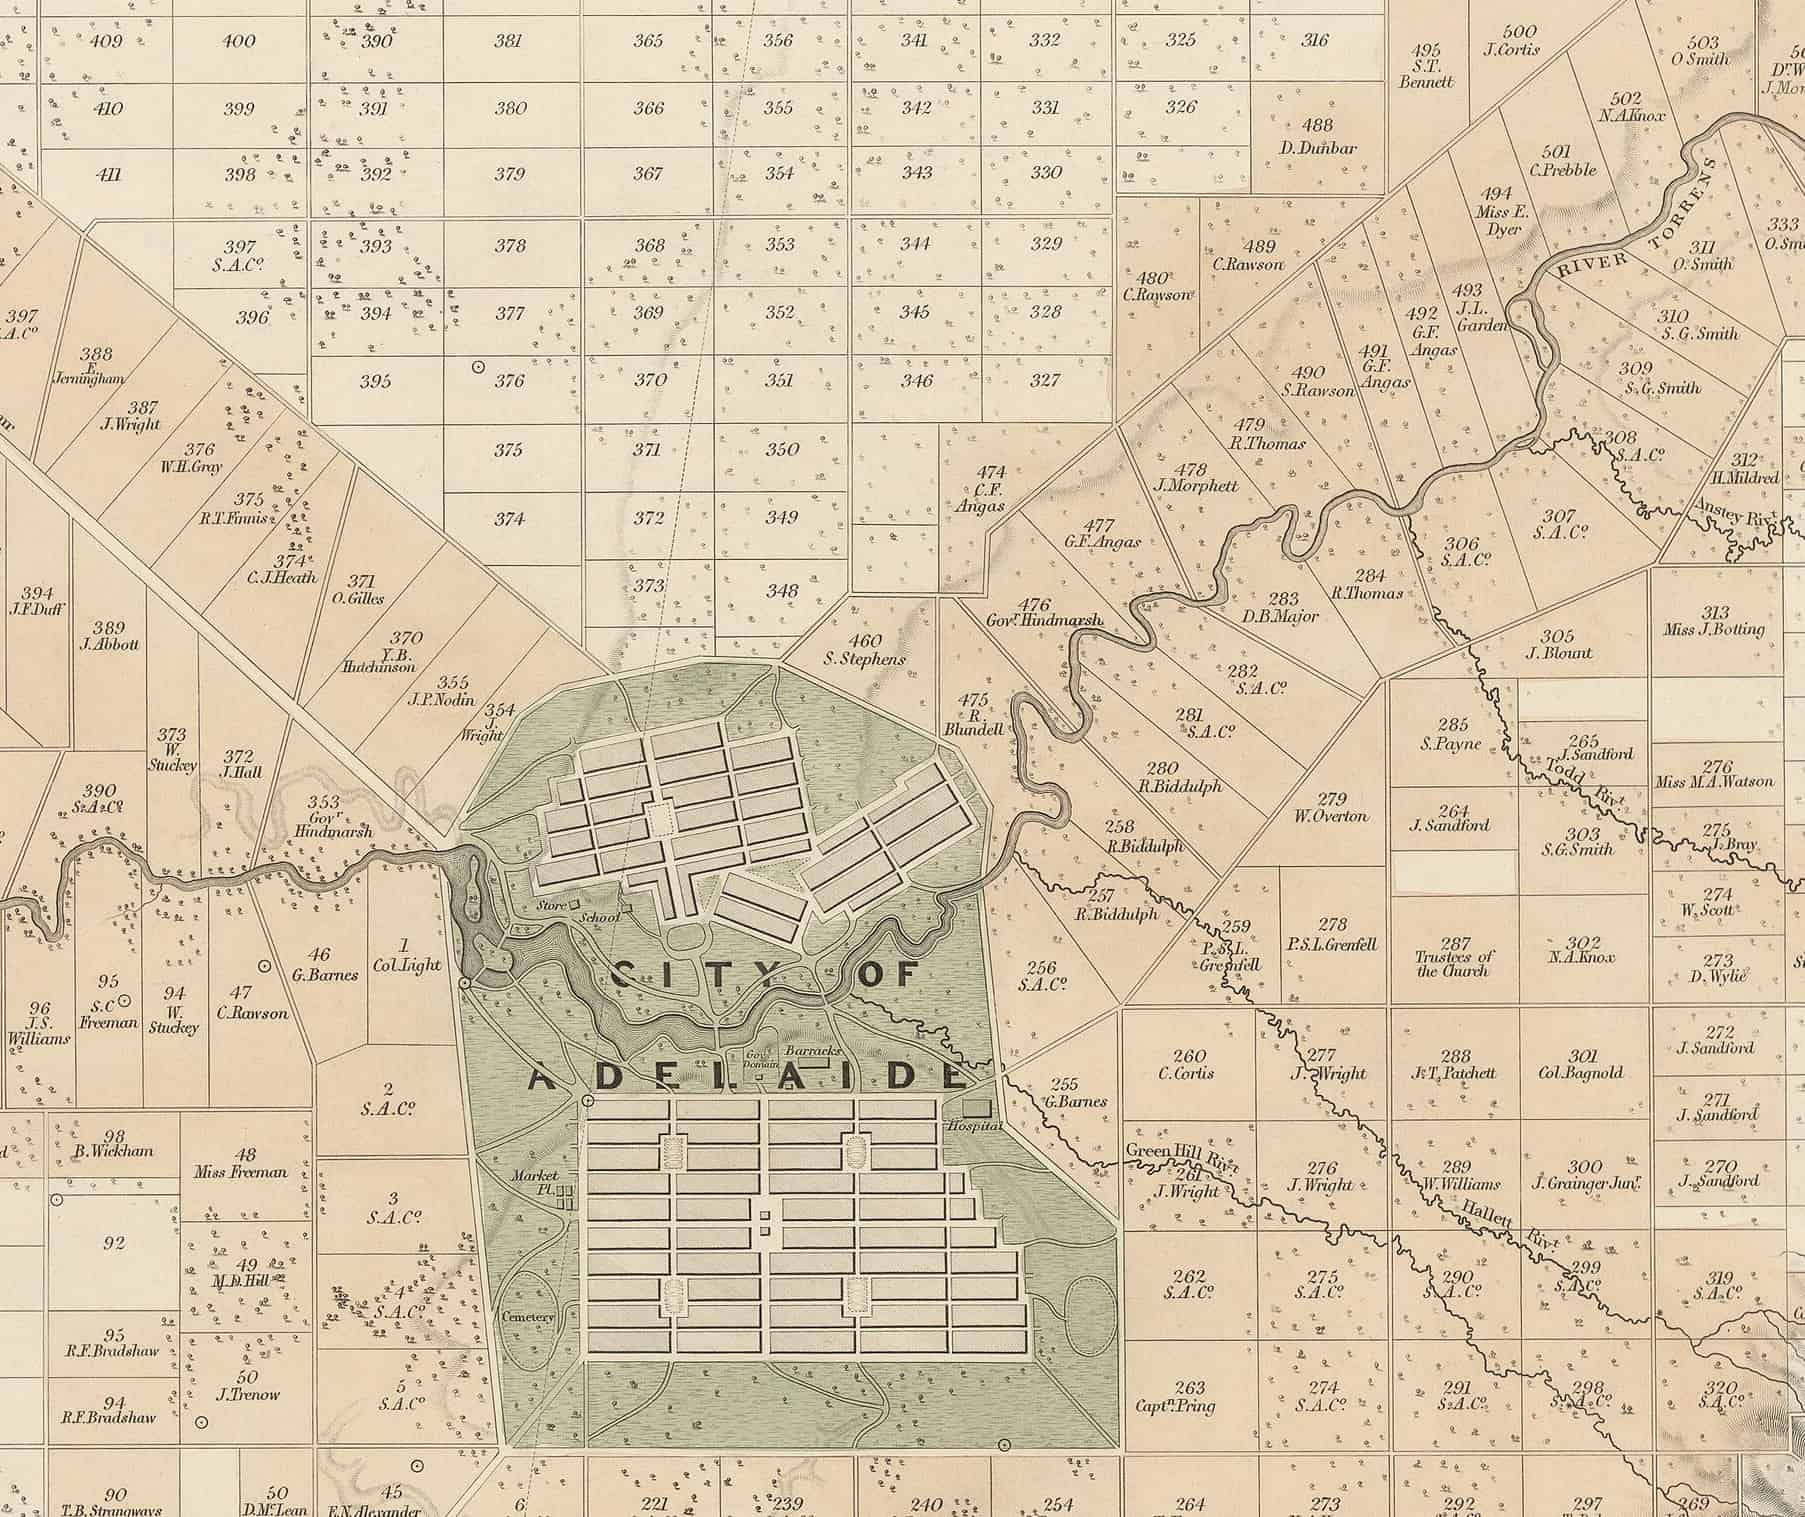
Colonel William Light, the Surveyor-General of South Australia, laid out Adelaide in 1837. This detail from John Arrowsmith’s 1839 map of the district, drawn from Light’s surveys, shows the city in two parts either side of the River Torrens, each a tidy grid of town acres with public squares, surrounded by a continuous belt of parkland in green. Around it, the country sections are numbered and labelled with their owners’ names.
How to do it: Where land ownership matters, number lots and sections, and give the public open-space structure one colour so it reads as a single system. The green ring is the idea of the Adelaide plan, and colour makes it the first thing you see.
14. Manuscript city plan with references
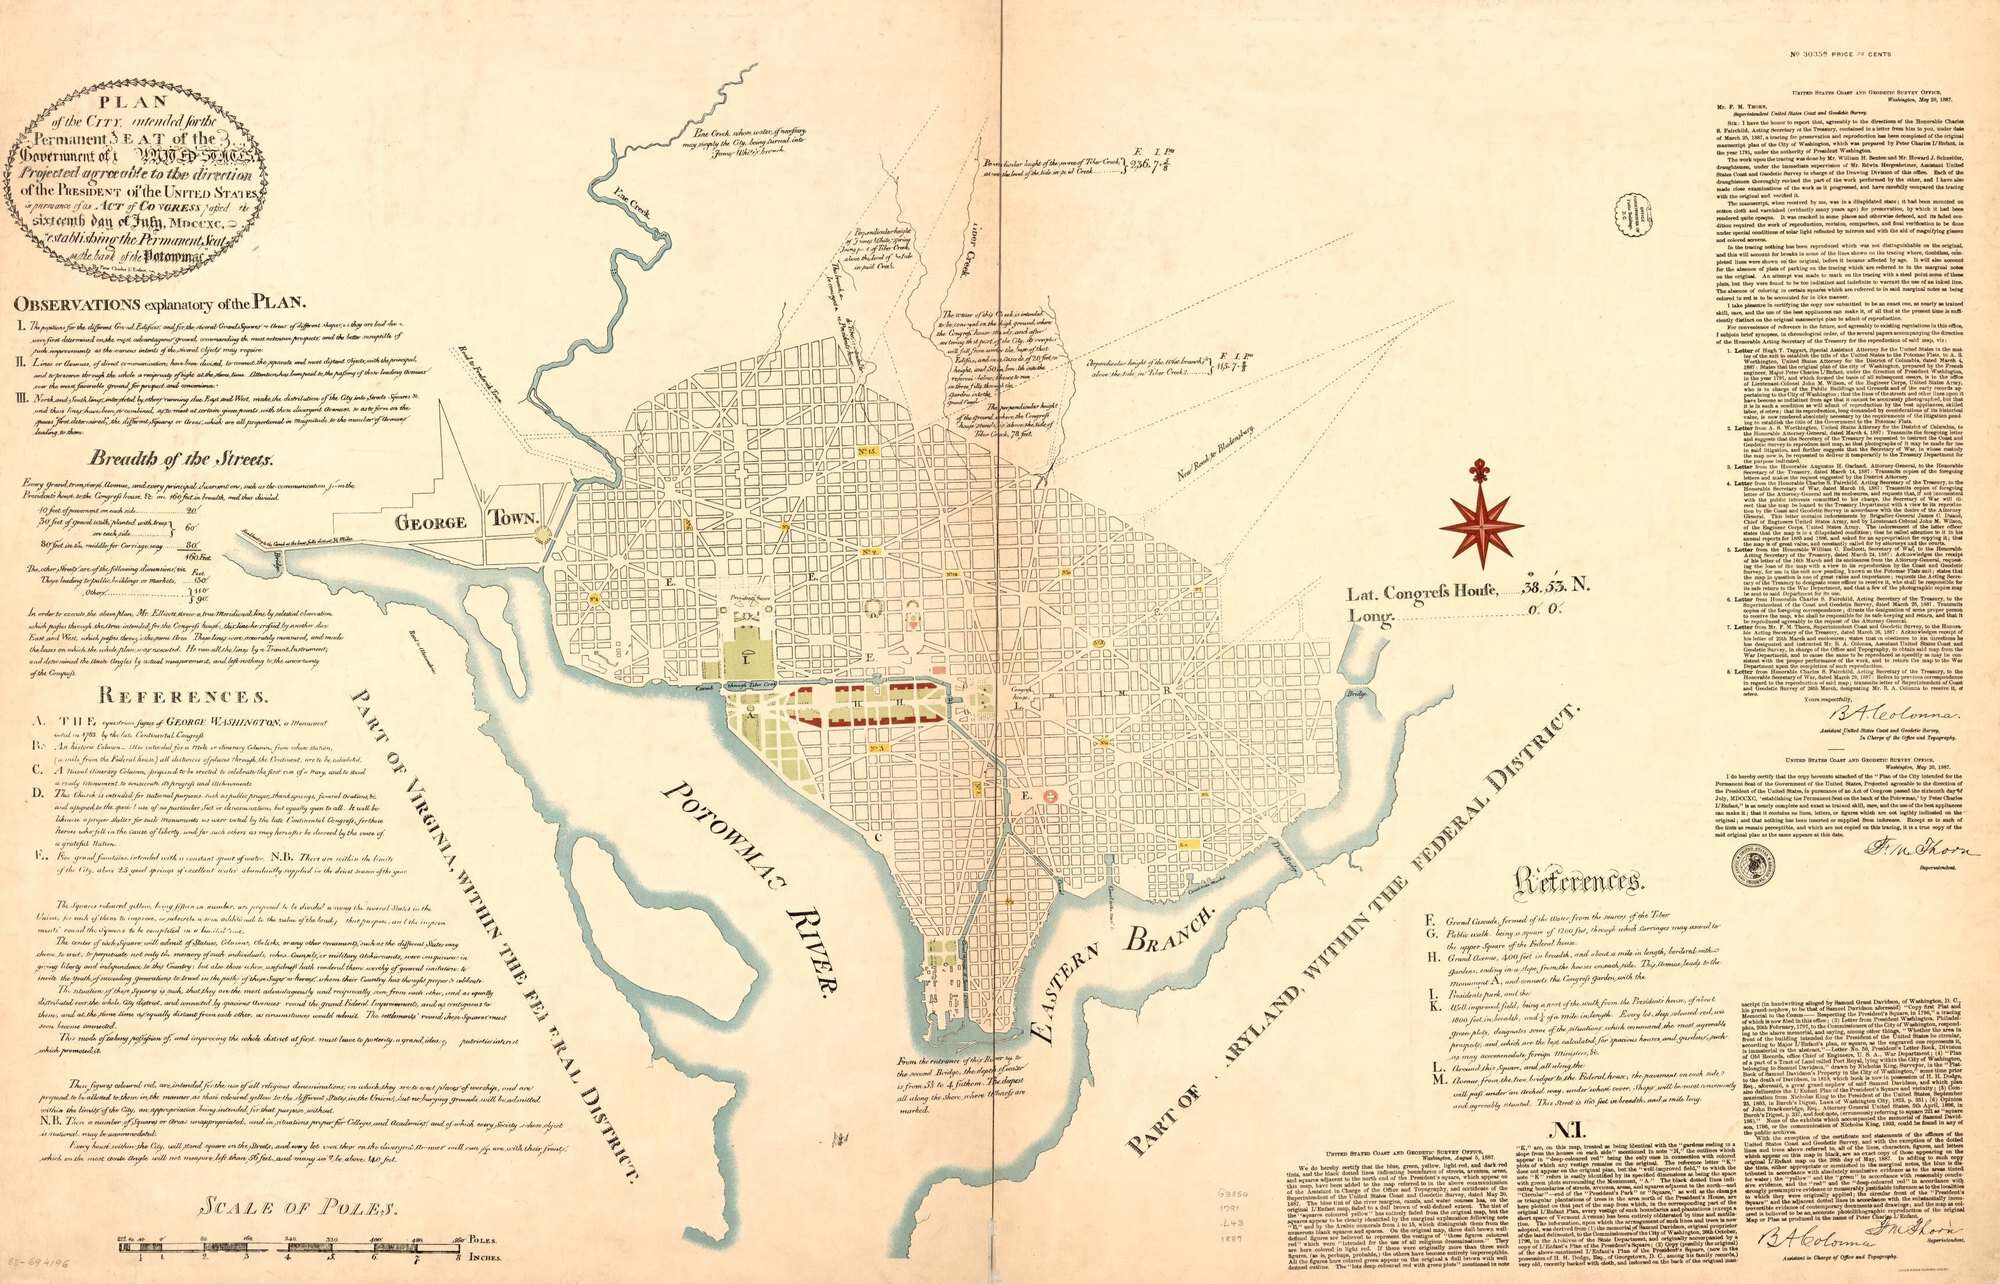
Pierre Charles L’Enfant’s 1791 plan for Washington, shown here in the 1887 facsimile held by the Library of Congress, combines a street grid with diagonal avenues radiating from the sites of the Capitol and the President’s House. Lettered references in the margins explain each square and avenue, so the drawing is both plan and brief.
How to do it: Put the explanation on the drawing itself: number key spaces and list them in a margin note, as L’Enfant did, so nobody has to search a separate report.
15. Engraved ideal city plan
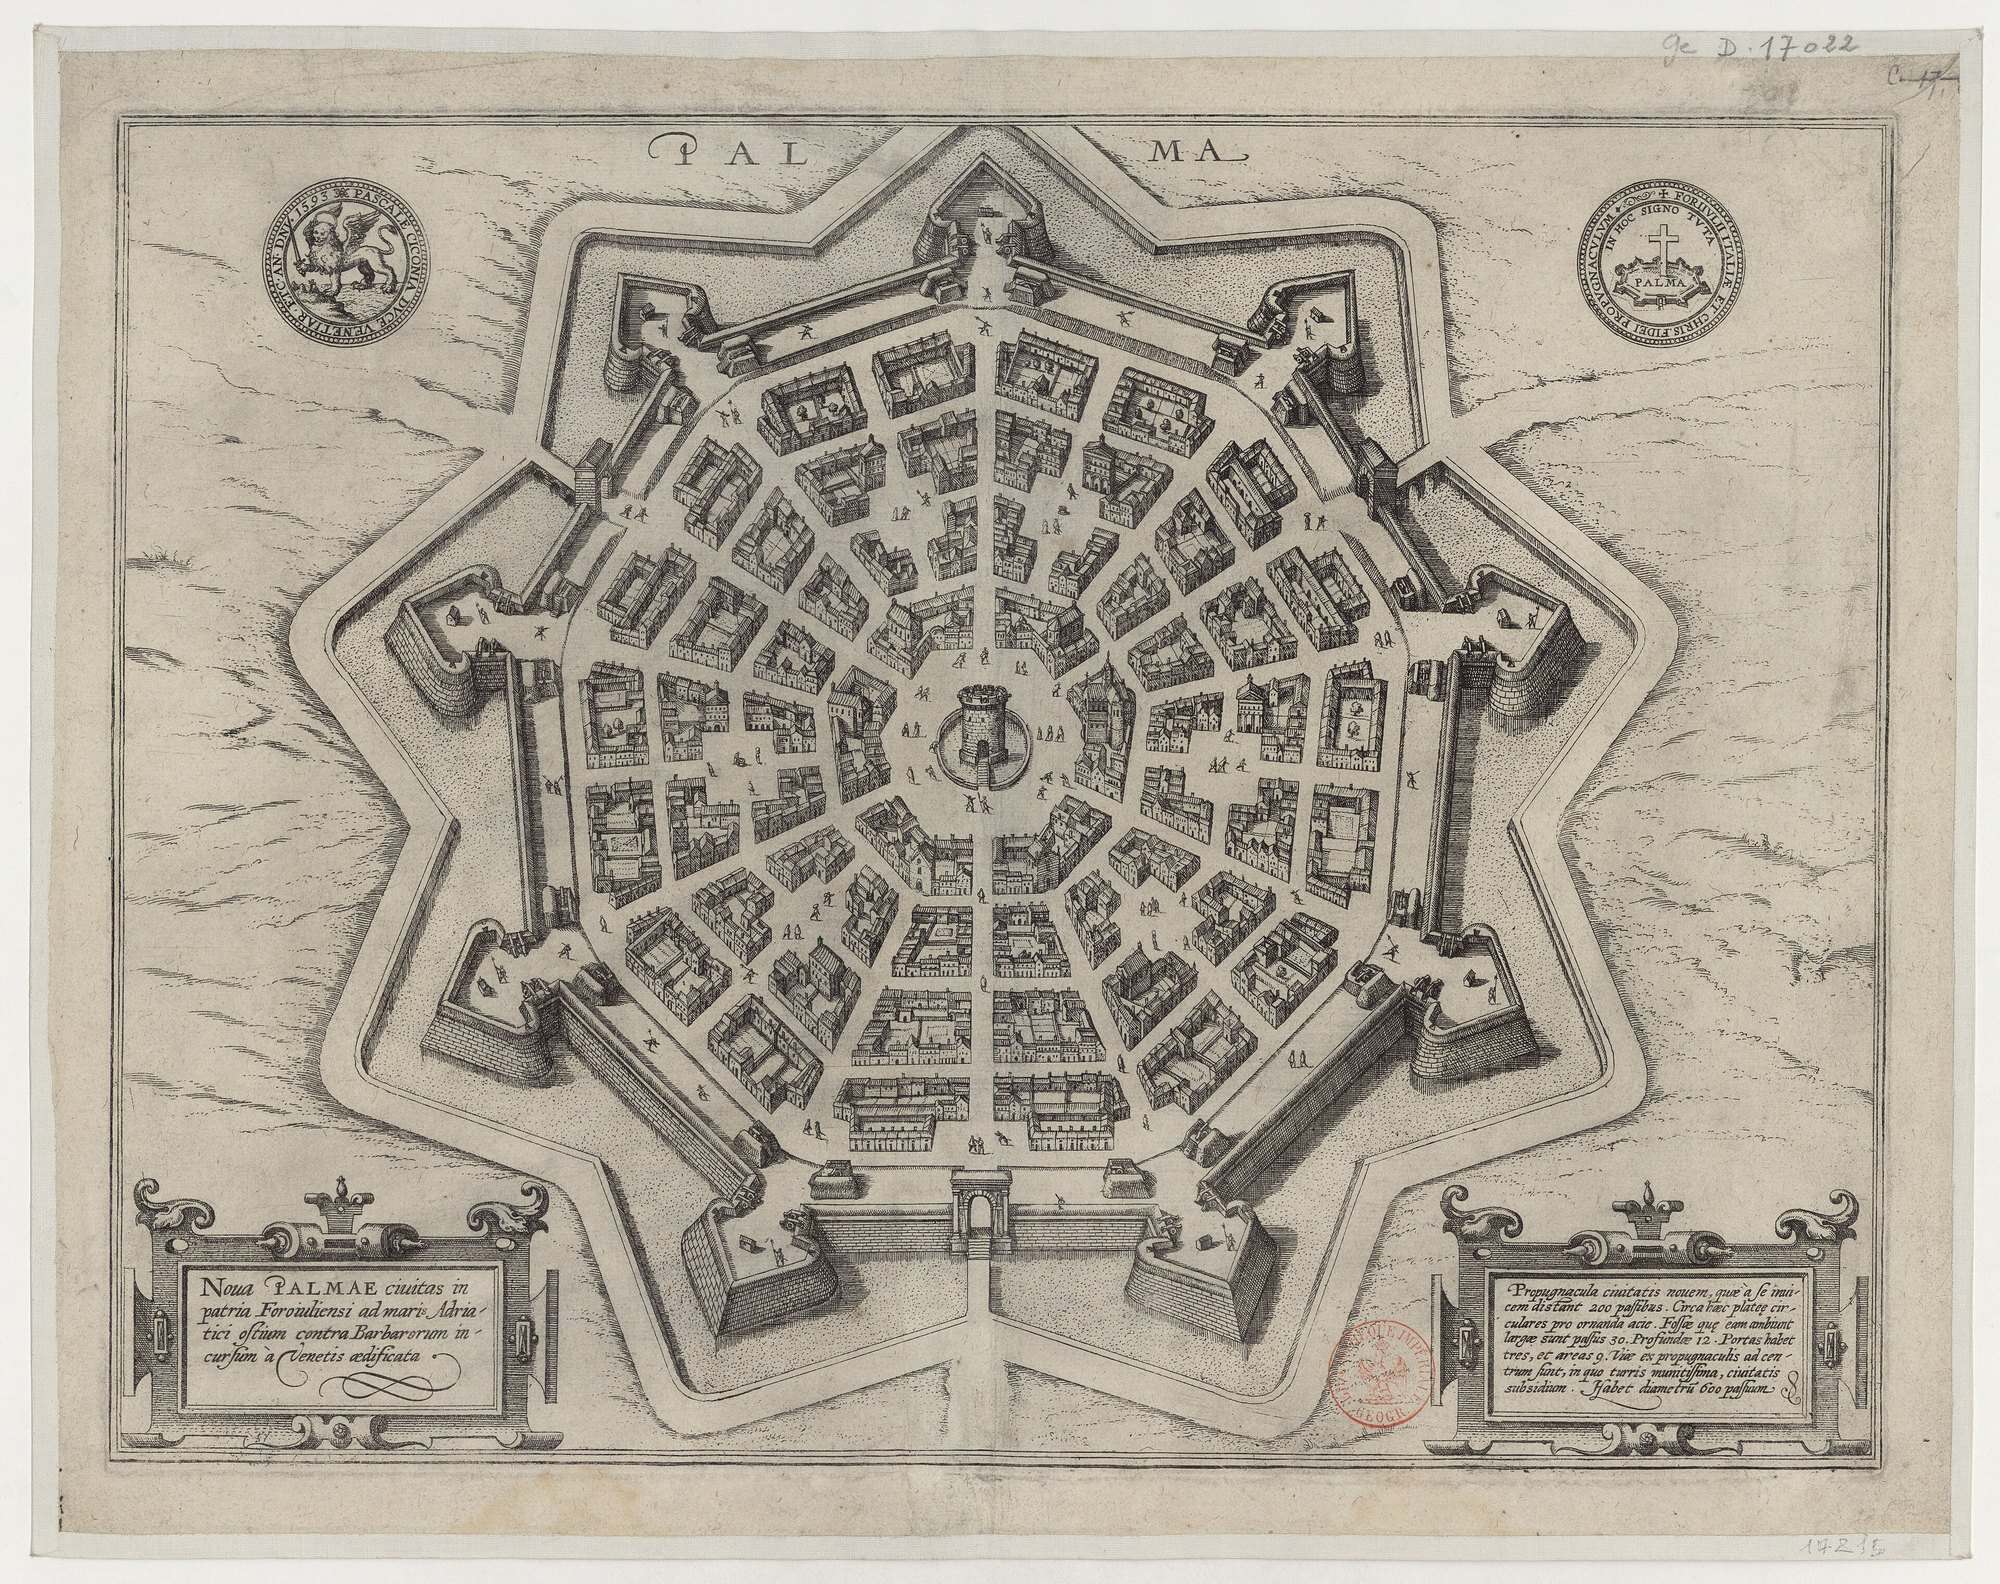
Palmanova, founded by the Republic of Venice in 1593 in north-eastern Italy, is the textbook ideal city. This engraved plan from the same year shows a nine-pointed star of fortifications around a hexagonal central square, with radial streets and rings of blocks. The design is usually credited to Giulio Savorgnan, with Vincenzo Scamozzi often named alongside him. The city was built close to this plan and still looks much the same from the air.
How to do it: Engraving-style plans use hatching instead of colour: hatch blocks in one direction, stipple open ground and frame the plan with a title cartouche. Digitally, a hatch library gives the same effect; our architectural textures guide has suitable hatch and paper textures.
Tips for drawing your own masterplan
- Fix the scale first. Choose one main scale for the set so every sheet overlays.
- Separate the layers. Draw land use, movement, open space, massing and phasing as separate plans.
- Use grey for the existing city. Proposed work in colour or black over a grey context is the quickest way to show what changes.
- Agree a colour key and keep it. If residential is yellow on the land-use plan, it stays yellow on every other sheet.
- Add scale cues. Trees, people and cars at plan scale help reviewers judge spaces. Our plan-view tree cutouts and top-view people work well on illustrative masterplans, and our landscape plan rendering styles post covers the open spaces in more detail.
- Show the edges. A masterplan that stops at its own boundary hides its most important decisions. Projects like the Lakeville V towers in Shanghai sit inside a larger master plan community, and the plan should show those links.
Masterplan drawing FAQ
What is a masterplan drawing?
It is a large-scale plan that sets out the long-term layout of a district, campus, town or city: streets, blocks and plots, land use, open space, massing and the order of construction. It is usually a set of drawings rather than one sheet.
What is the difference between a masterplan and a site plan?
A site plan shows one building or small group on a single site. A masterplan covers a much larger area and many future buildings, and sets the rules they follow.
What scale is a masterplan drawn at?
Most urban masterplans are drawn at 1:1000, 1:2000 or 1:5000, with typical blocks or streets detailed at 1:200 or 1:500.
What software is used for masterplan drawings?
AutoCAD, Vectorworks or Rhino for the base plan, GIS (QGIS or ArcGIS) for large areas, SketchUp or Rhino for massing, and Illustrator or Photoshop for colour plans and rendering.
What should a masterplan drawing set include?
At minimum: context, concept, land-use, movement, open-space, massing and phasing plans, plus one illustrative plan or aerial view, all sharing one scale, north point and colour key.


Recent Posts
Masterplan Drawing Styles: 15 Examples and Tips
Landscape Plan Rendering Styles: 15 Examples and Tips
Mid-Century Modern Architecture: History, Key Features and 15 Famous Examples